The User Engagement Report provides usage metrics for Ask iManage.
To view this report, you must be a member of the ASK_IMANAGE_ANALYTICS global group in iManage Control Center.
For more information, contact your administrator or refer to the Setting up the user engagement report.
Accessing the Report
In iManage Work at cloudimanage.com, select Ask iManage from the left navigation pane.
On the Ask iManage home page, select Library and then select the libraries from the other regions.
Select Ask iManage Usage
.
Report Components
The report displays the following components.
IMPORTANT: The Ask iManage data displayed is as per the libraries selected. If you have users across various regions and want to view their usage data, then you'll have to select the libraries from the other regions from the Library drop-down.
A Date Range selector. You can change this to Last 7 days, Last 30 days, or Last 90 days.
The following details:
Active users
Inactive users
Active user rate
Actions per active user
Document questions
DMS questions
Comparisons
Figure: Usage details
Active vs. Inactive Users: A pie chart of the user base.
Figure: Total number of users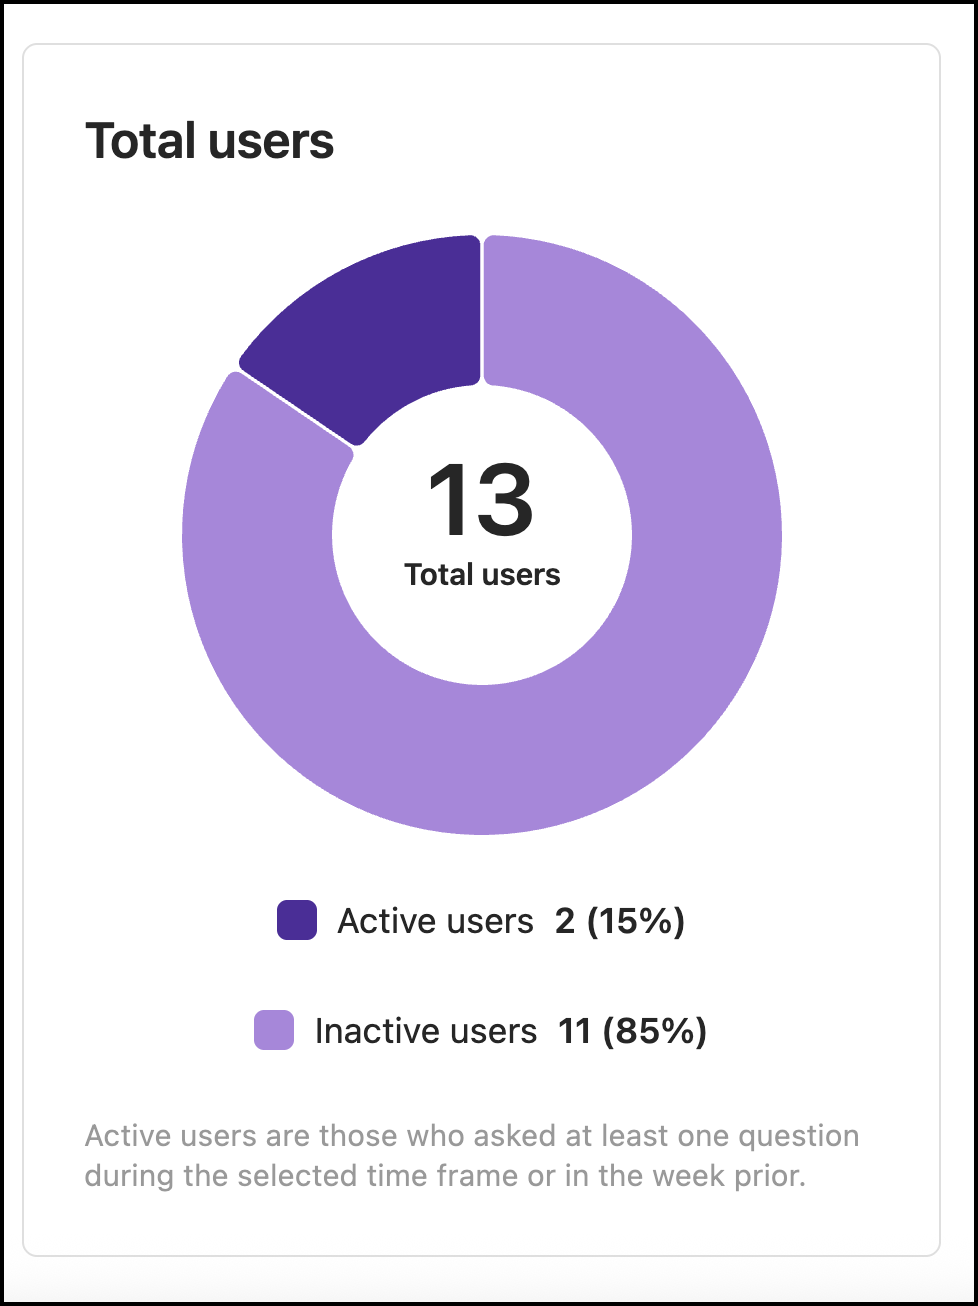
Active Users Over Time: A line or bar chart view.
Figure: Active users in line chart format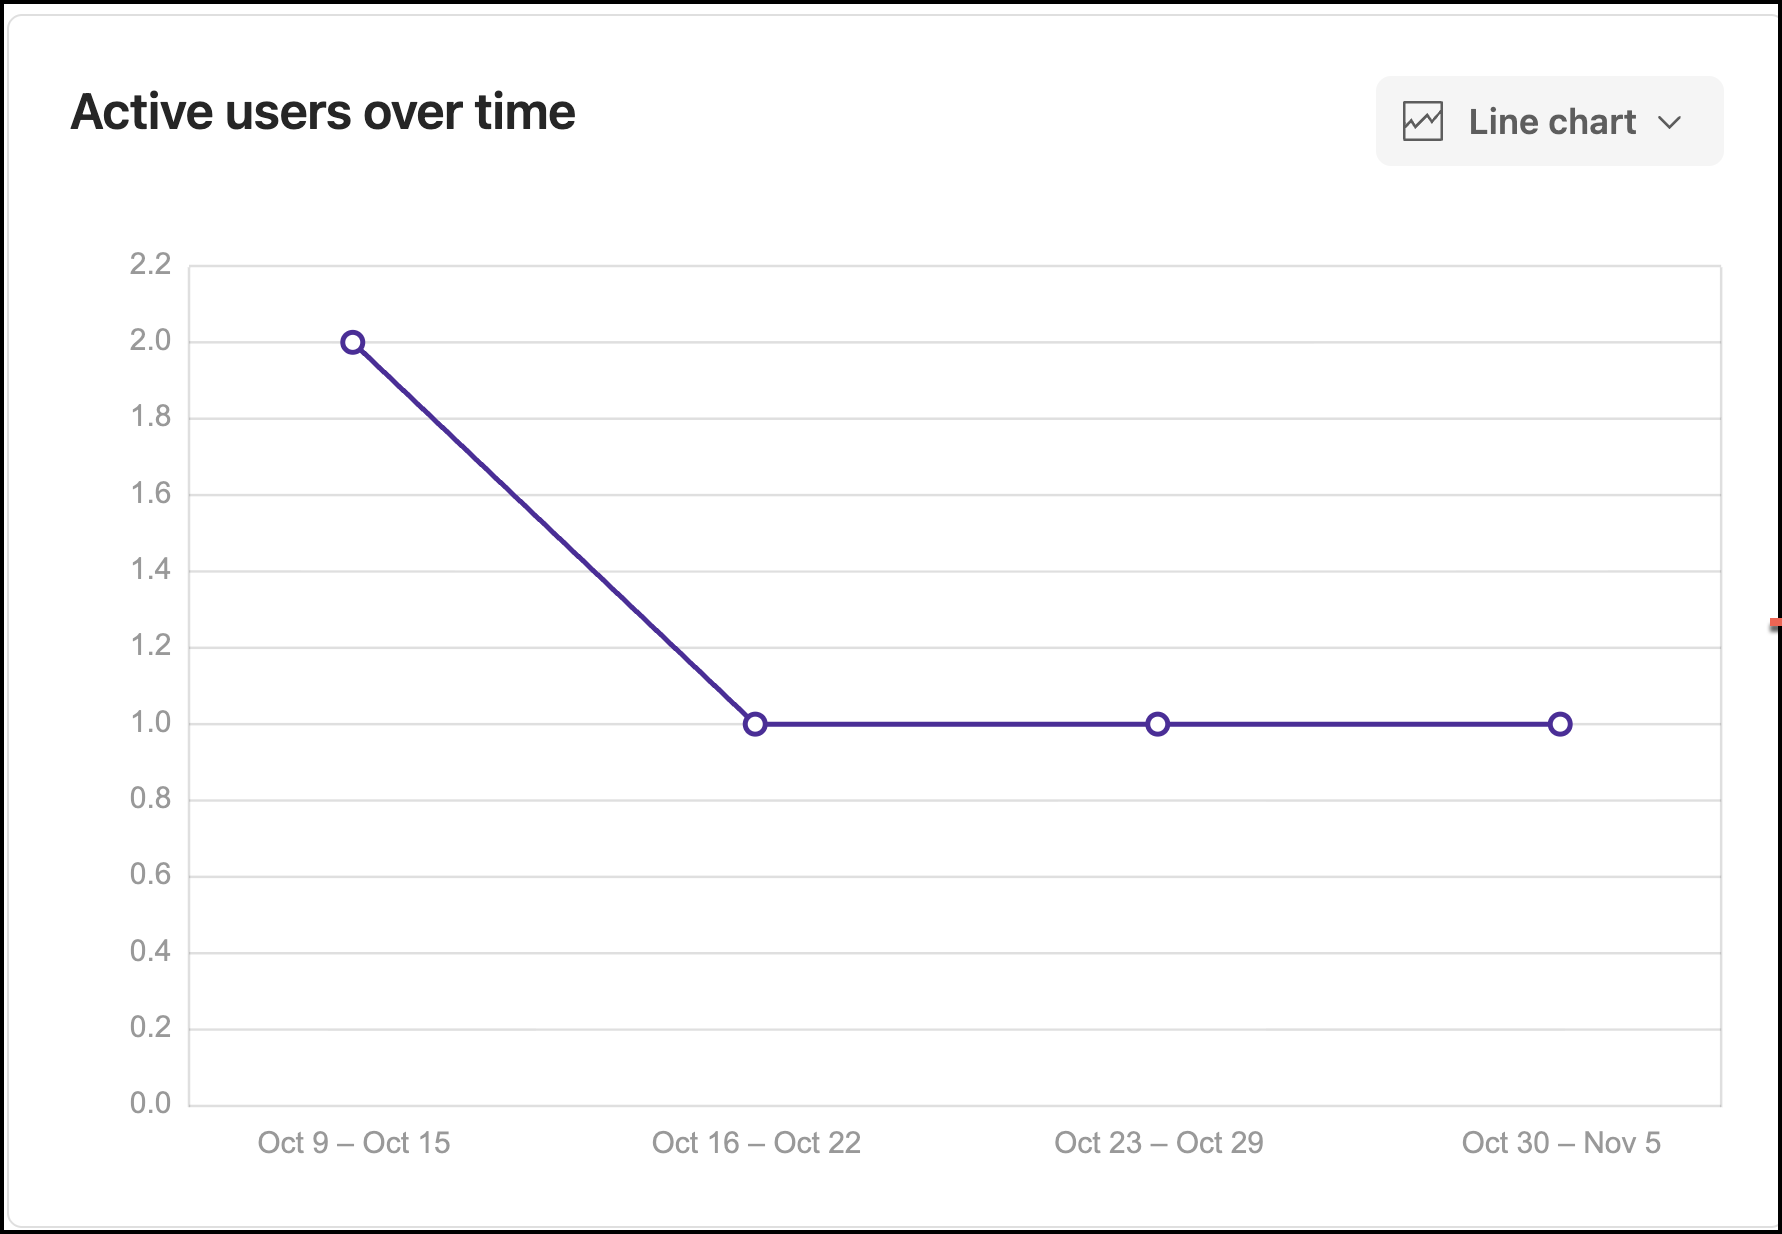
Questions Asked Over Time: A line or bar chart view.
Figure: Questions asked over time in bar-chart format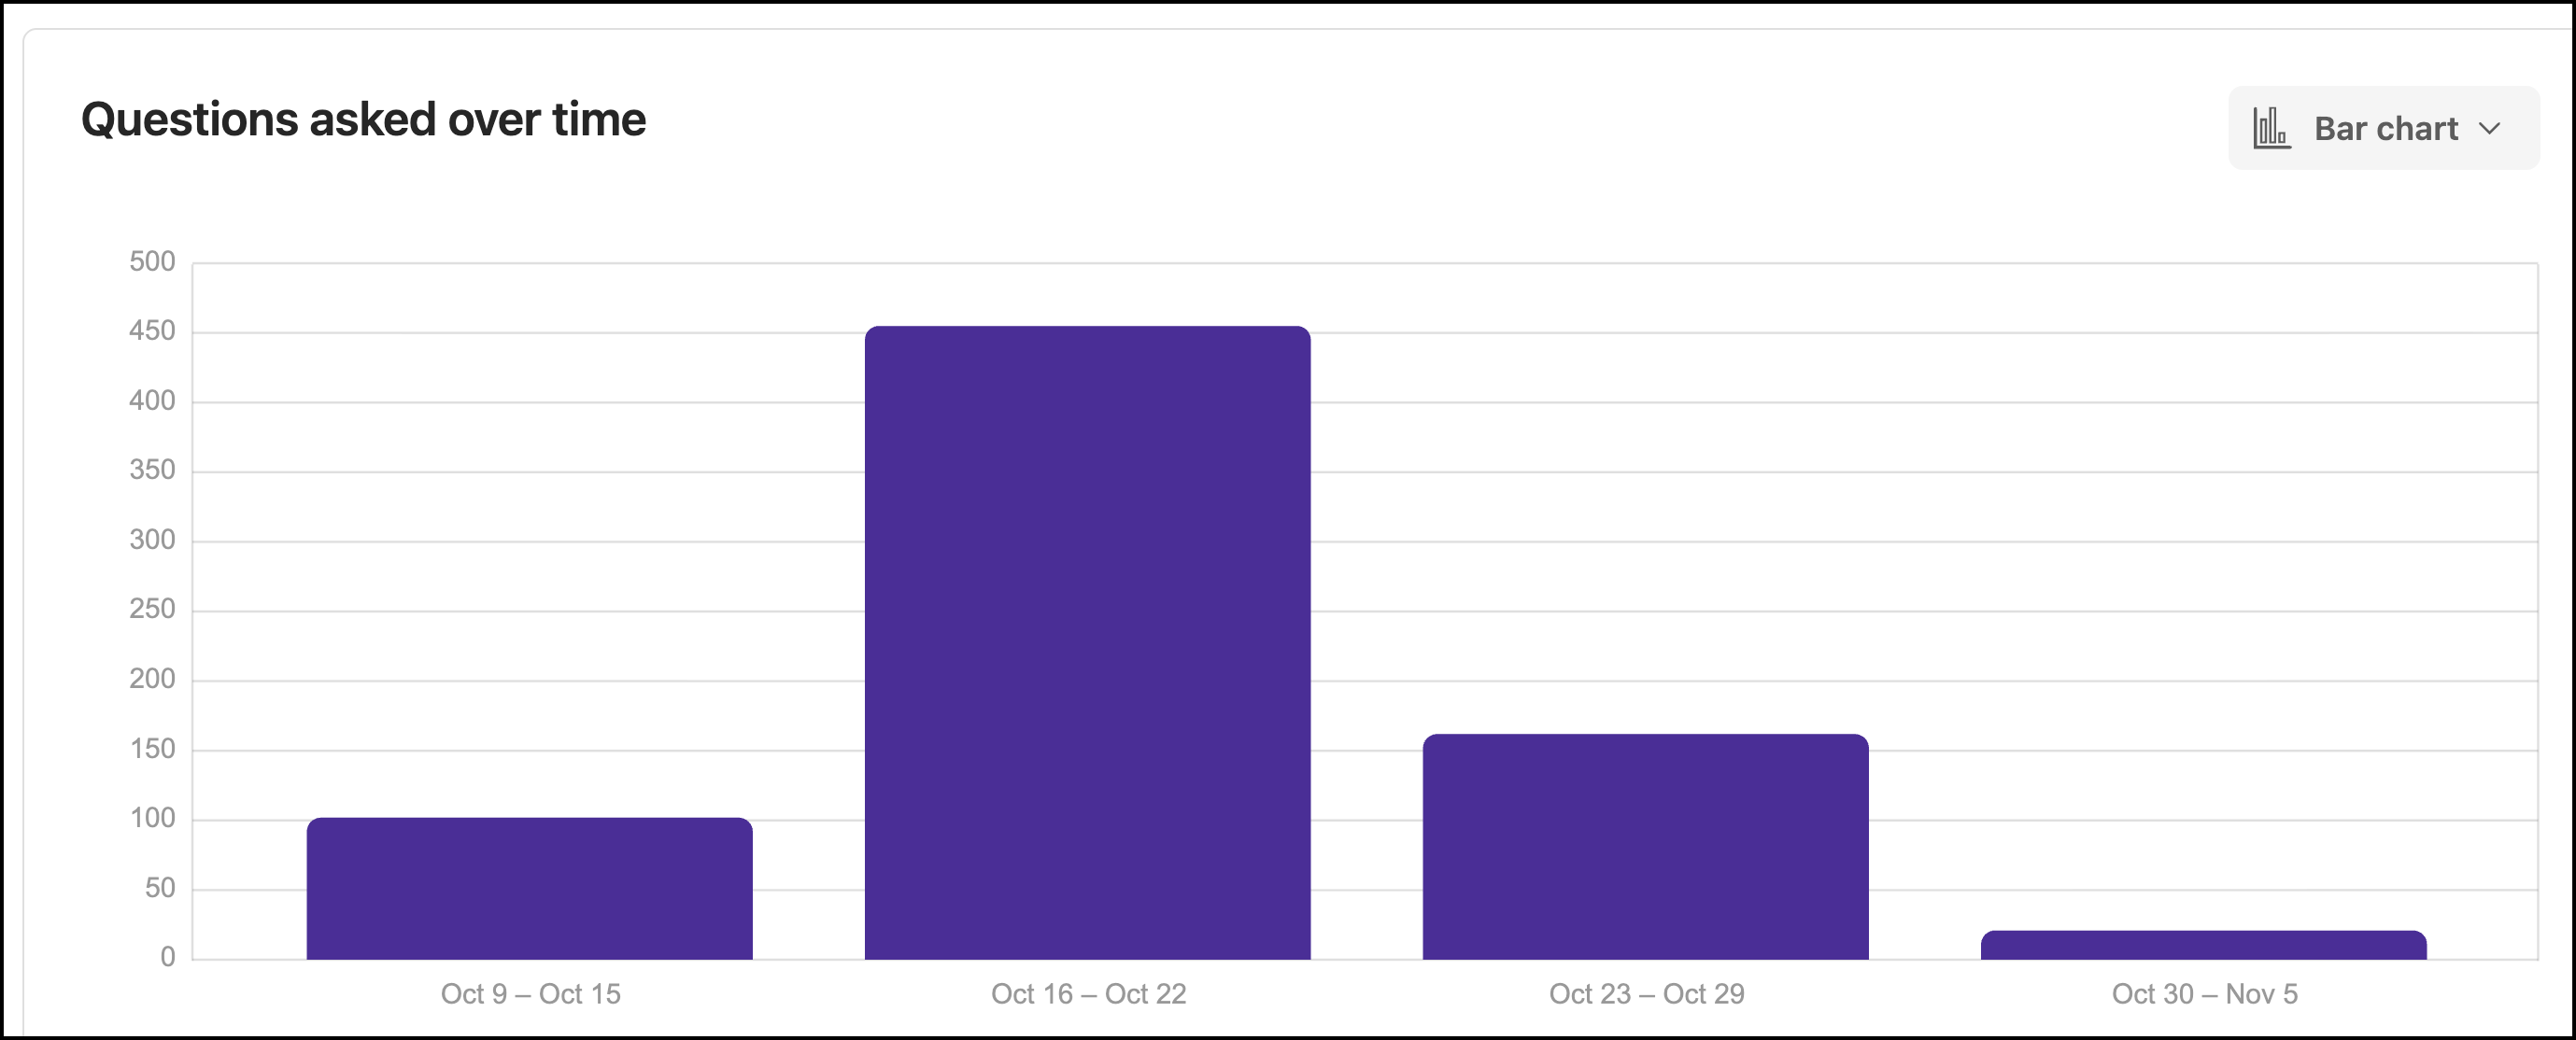
User Usage:
Active users:
Figure: Active users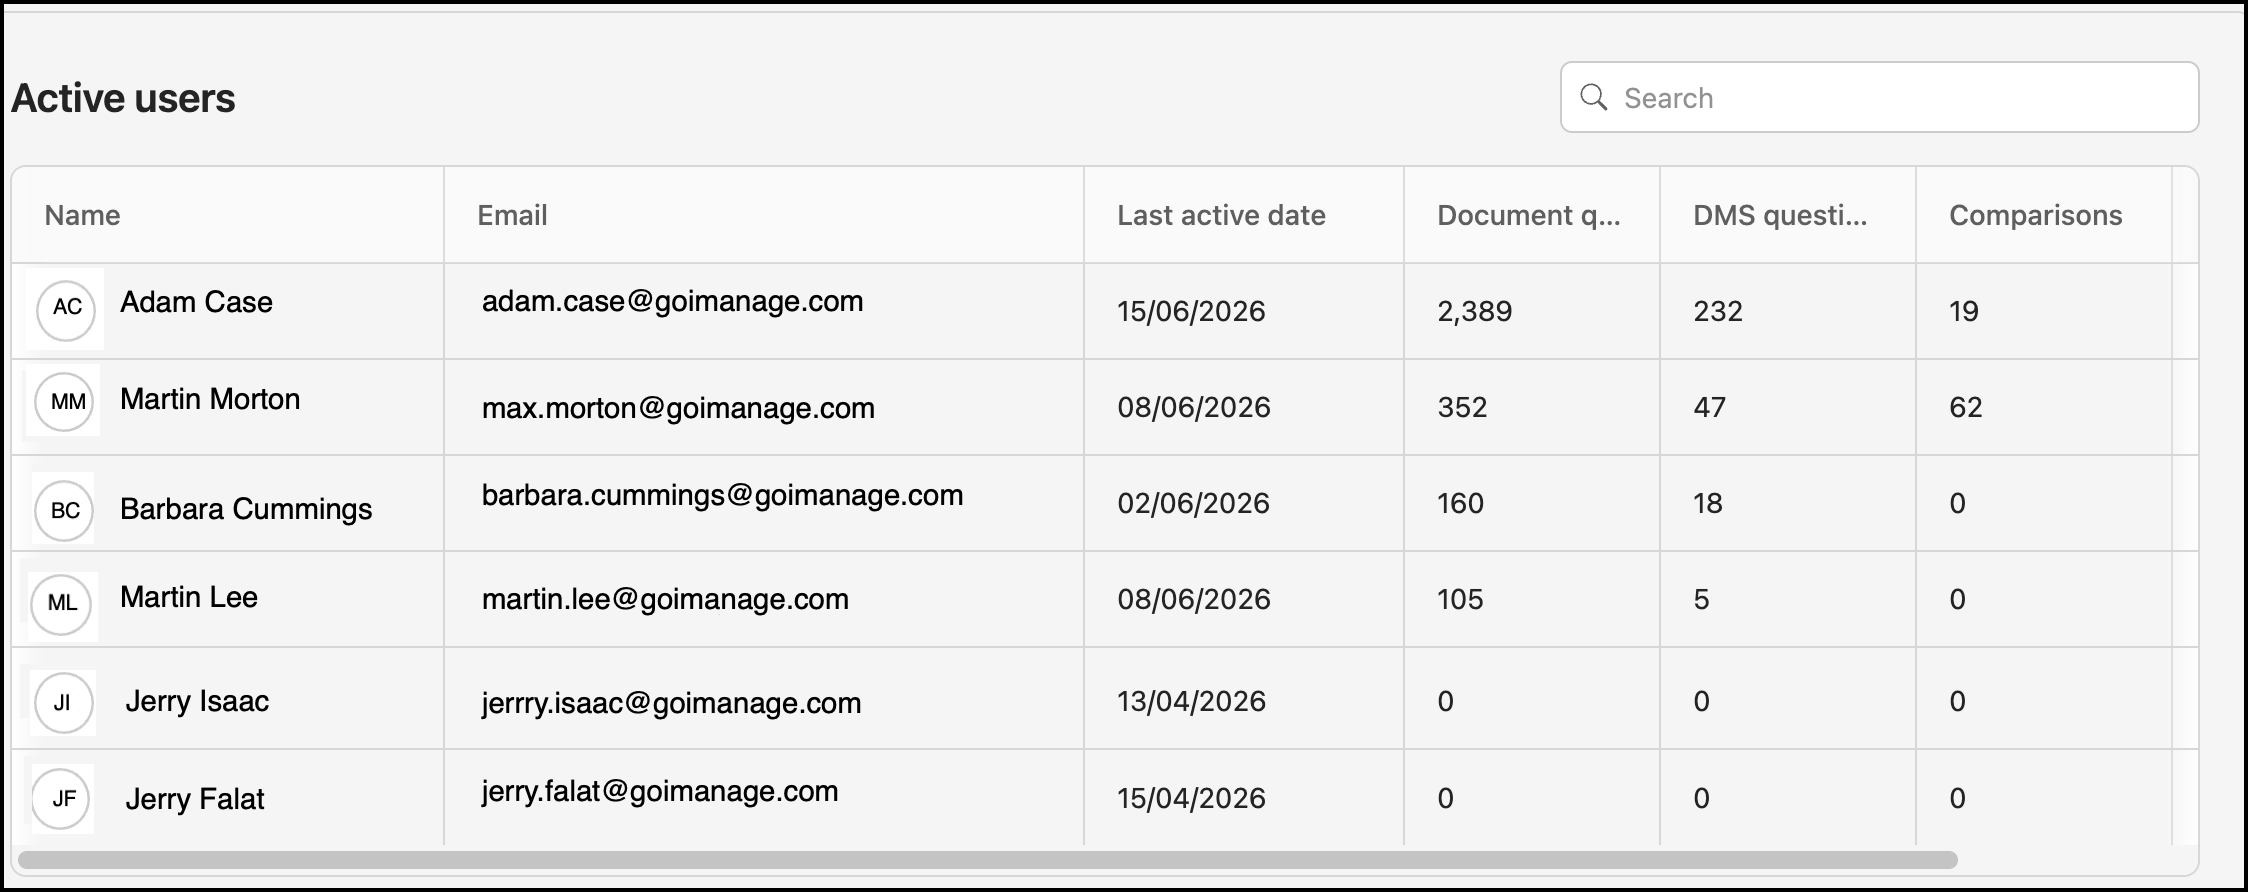
Inactive users:
Figure: Inactive users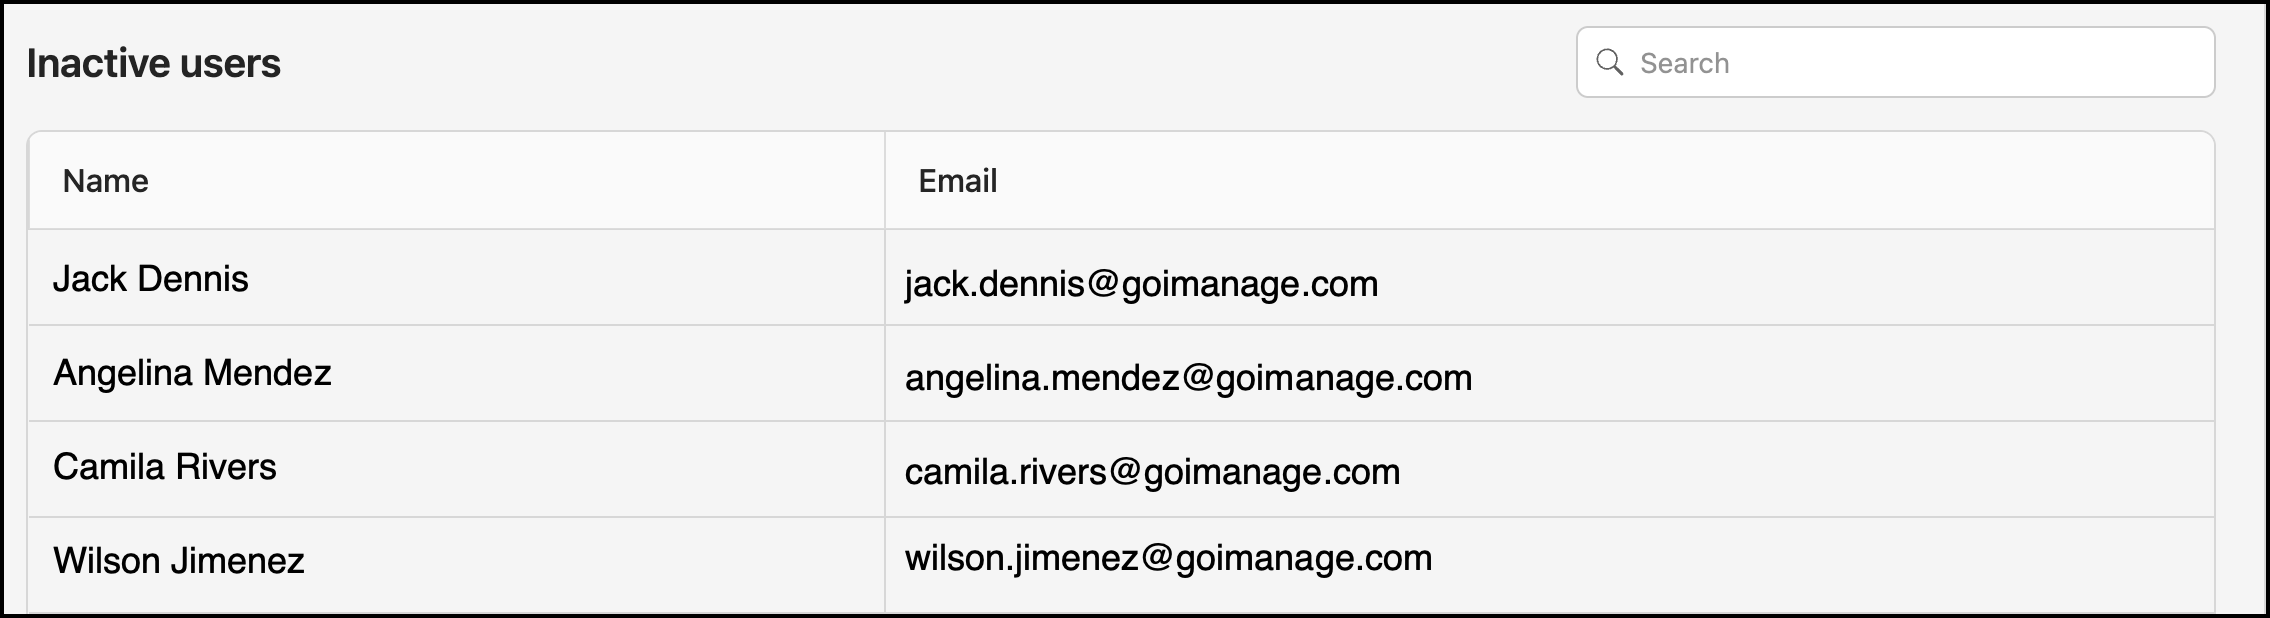
Actions
Export: Downloads the user details table as a Microsoft Excel file.
Back to Projects: Returns to the Projects page.
How Questions Asked is Calculated
The "Total questions asked" metric is calculated by multiplying the number of questions in a query by the number of documents the query runs against.
Example 1: A single question on 1 document = 1 question counted.
Example 2: A question list with 10 questions on 1 document = 10 questions counted.
Example 3: An "Ask Across" task on 10 documents = 10 questions counted.