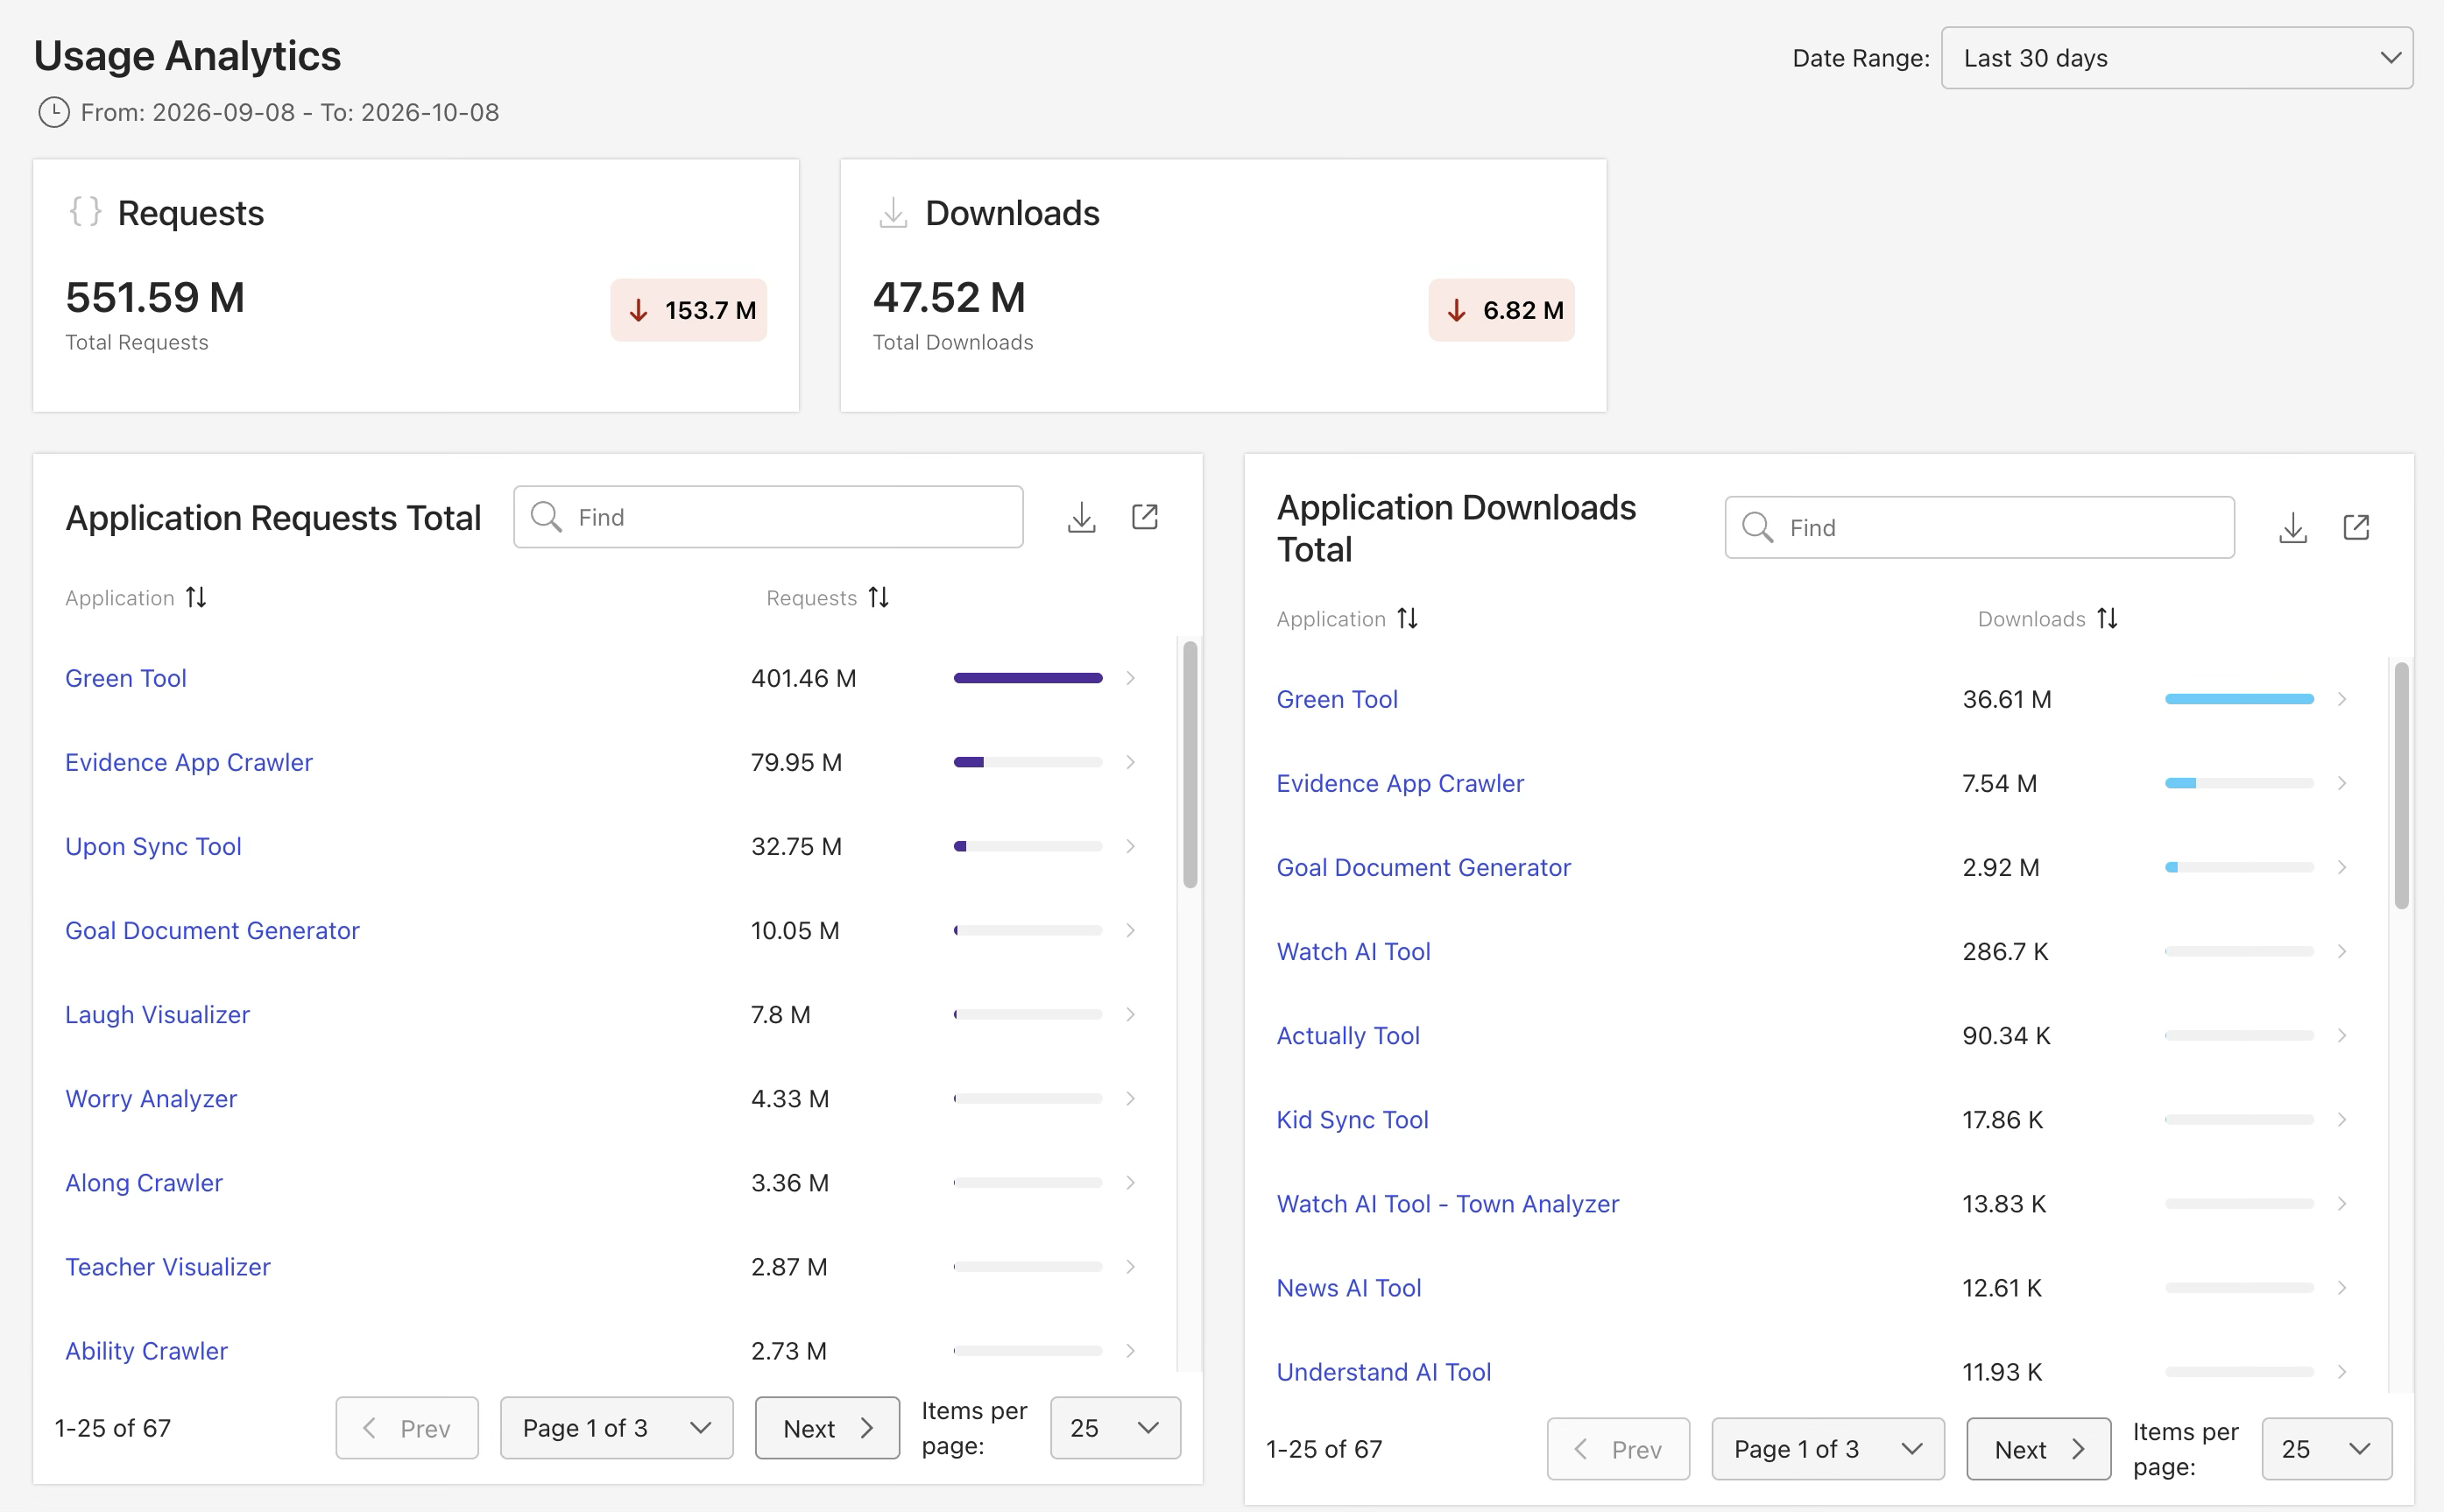
The Usage Analytics page in the Partner App Analytics section of iManage Admin Portal provides a centralized view of application usage across your iManage Cloud customer environments, helping you monitor consumption trends, customer engagement, and application adoption during a selected reporting period. Through a collection of dashboard tiles, the page presents both high-level metrics and detailed usage data for application requests and downloads.
The page lets users analyze usage from multiple perspectives, including overall request and download activity, application-level consumption, customer-level activity, and combined customer and application usage. Interactive features such as searching, sorting, filtering, exporting data, and accessing detailed trend reports help users identify usage patterns, compare activity across customers and applications, and gain deeper insight into how applications are being consumed over time. Together, the dashboard tiles provide a comprehensive view of customer engagement and application utilization, supporting data-driven decision-making and usage analysis.
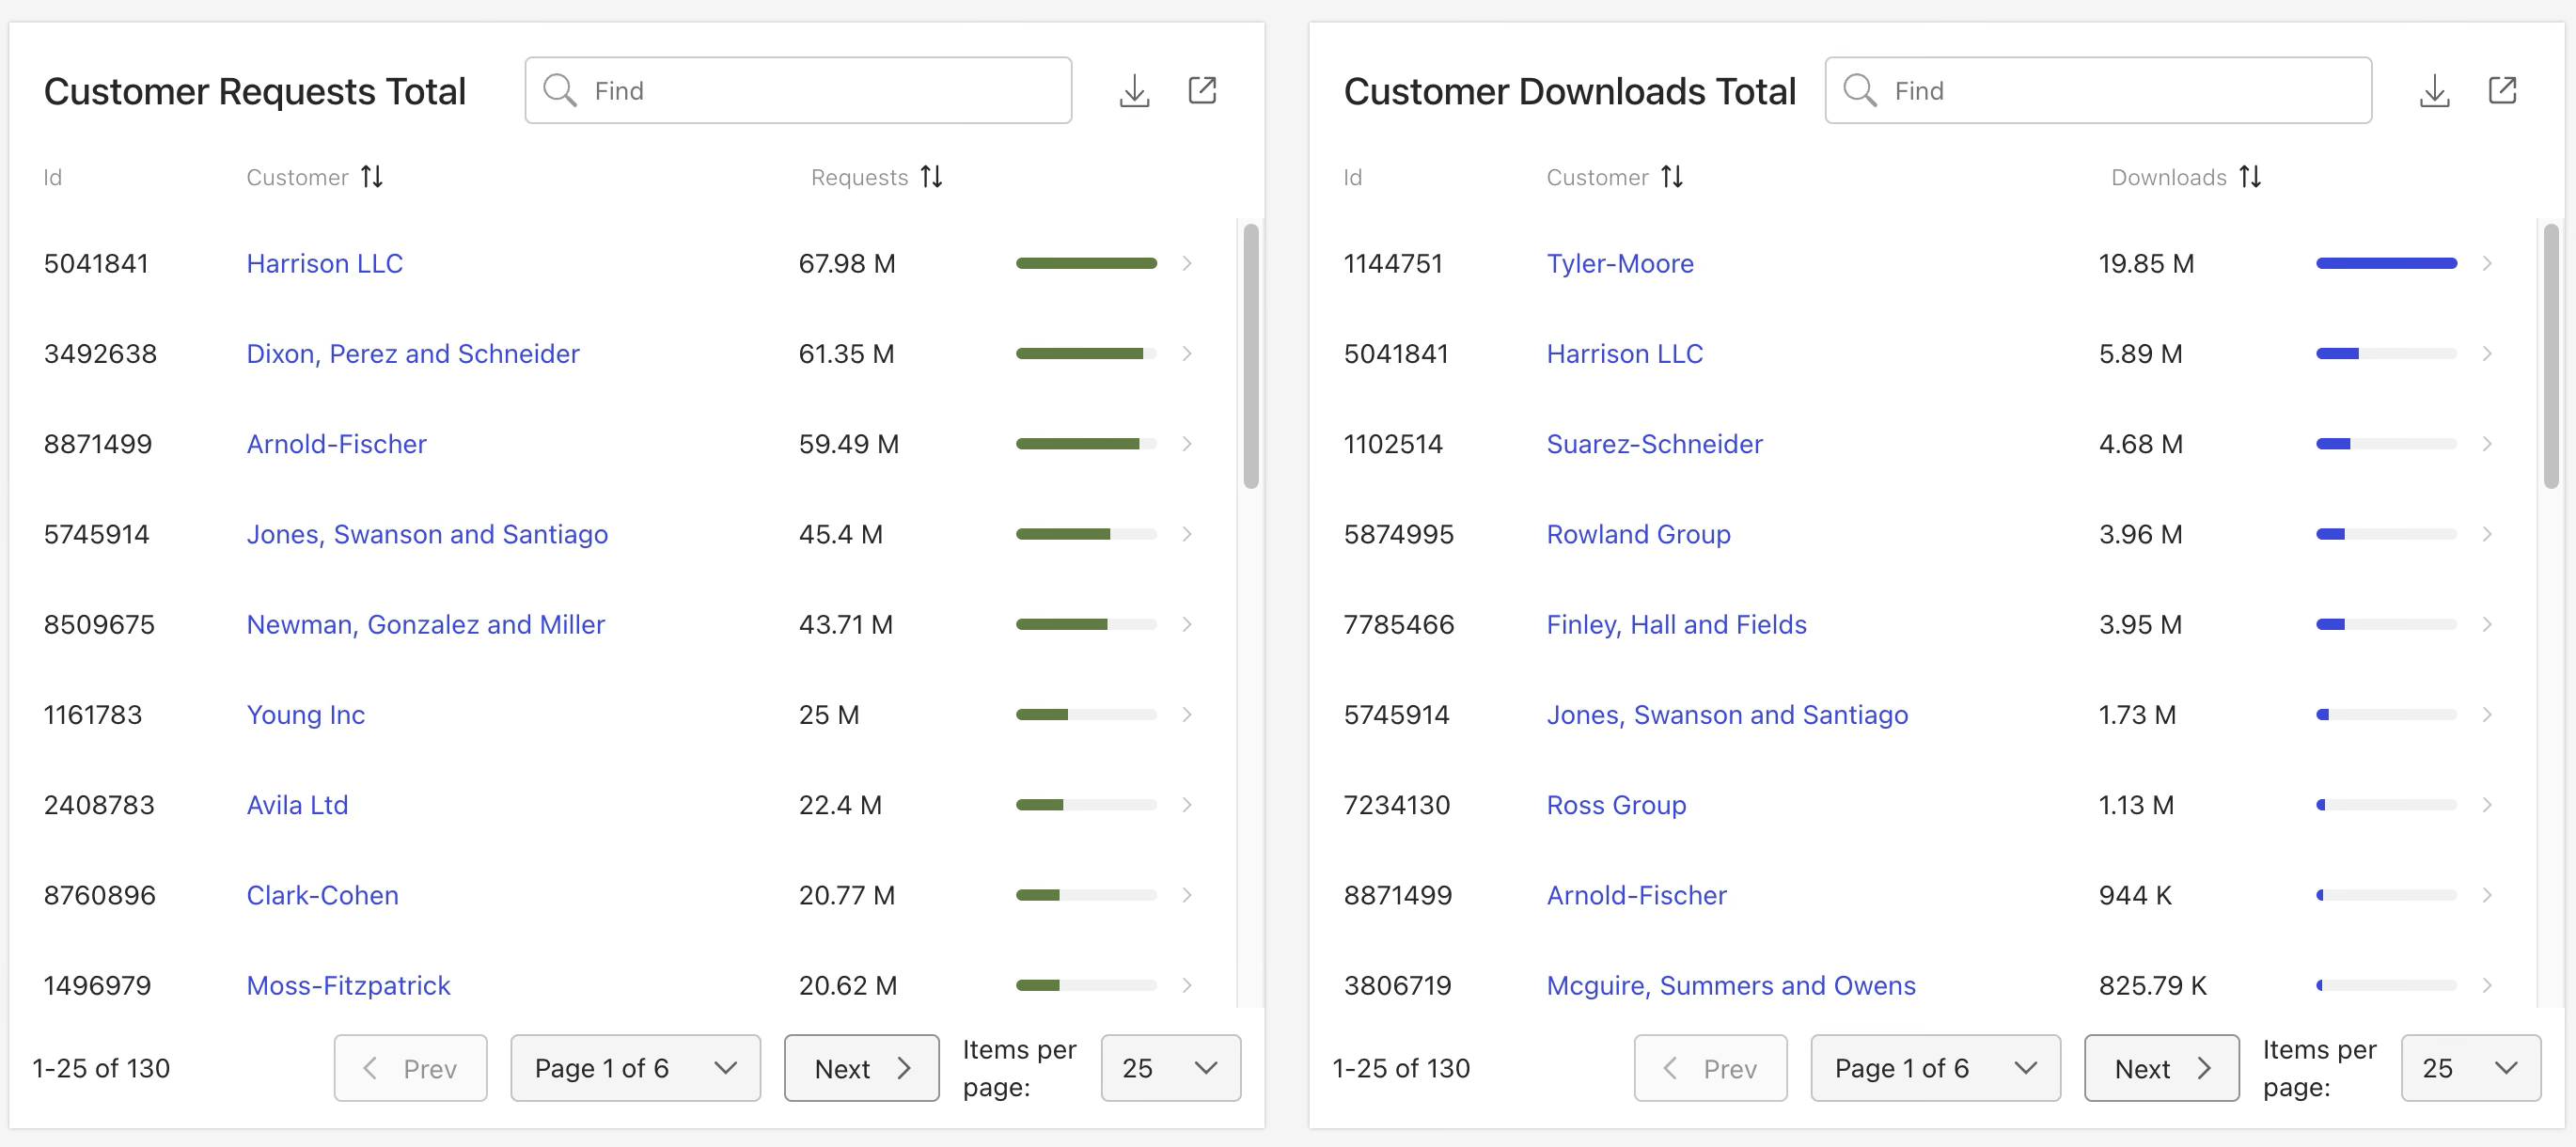
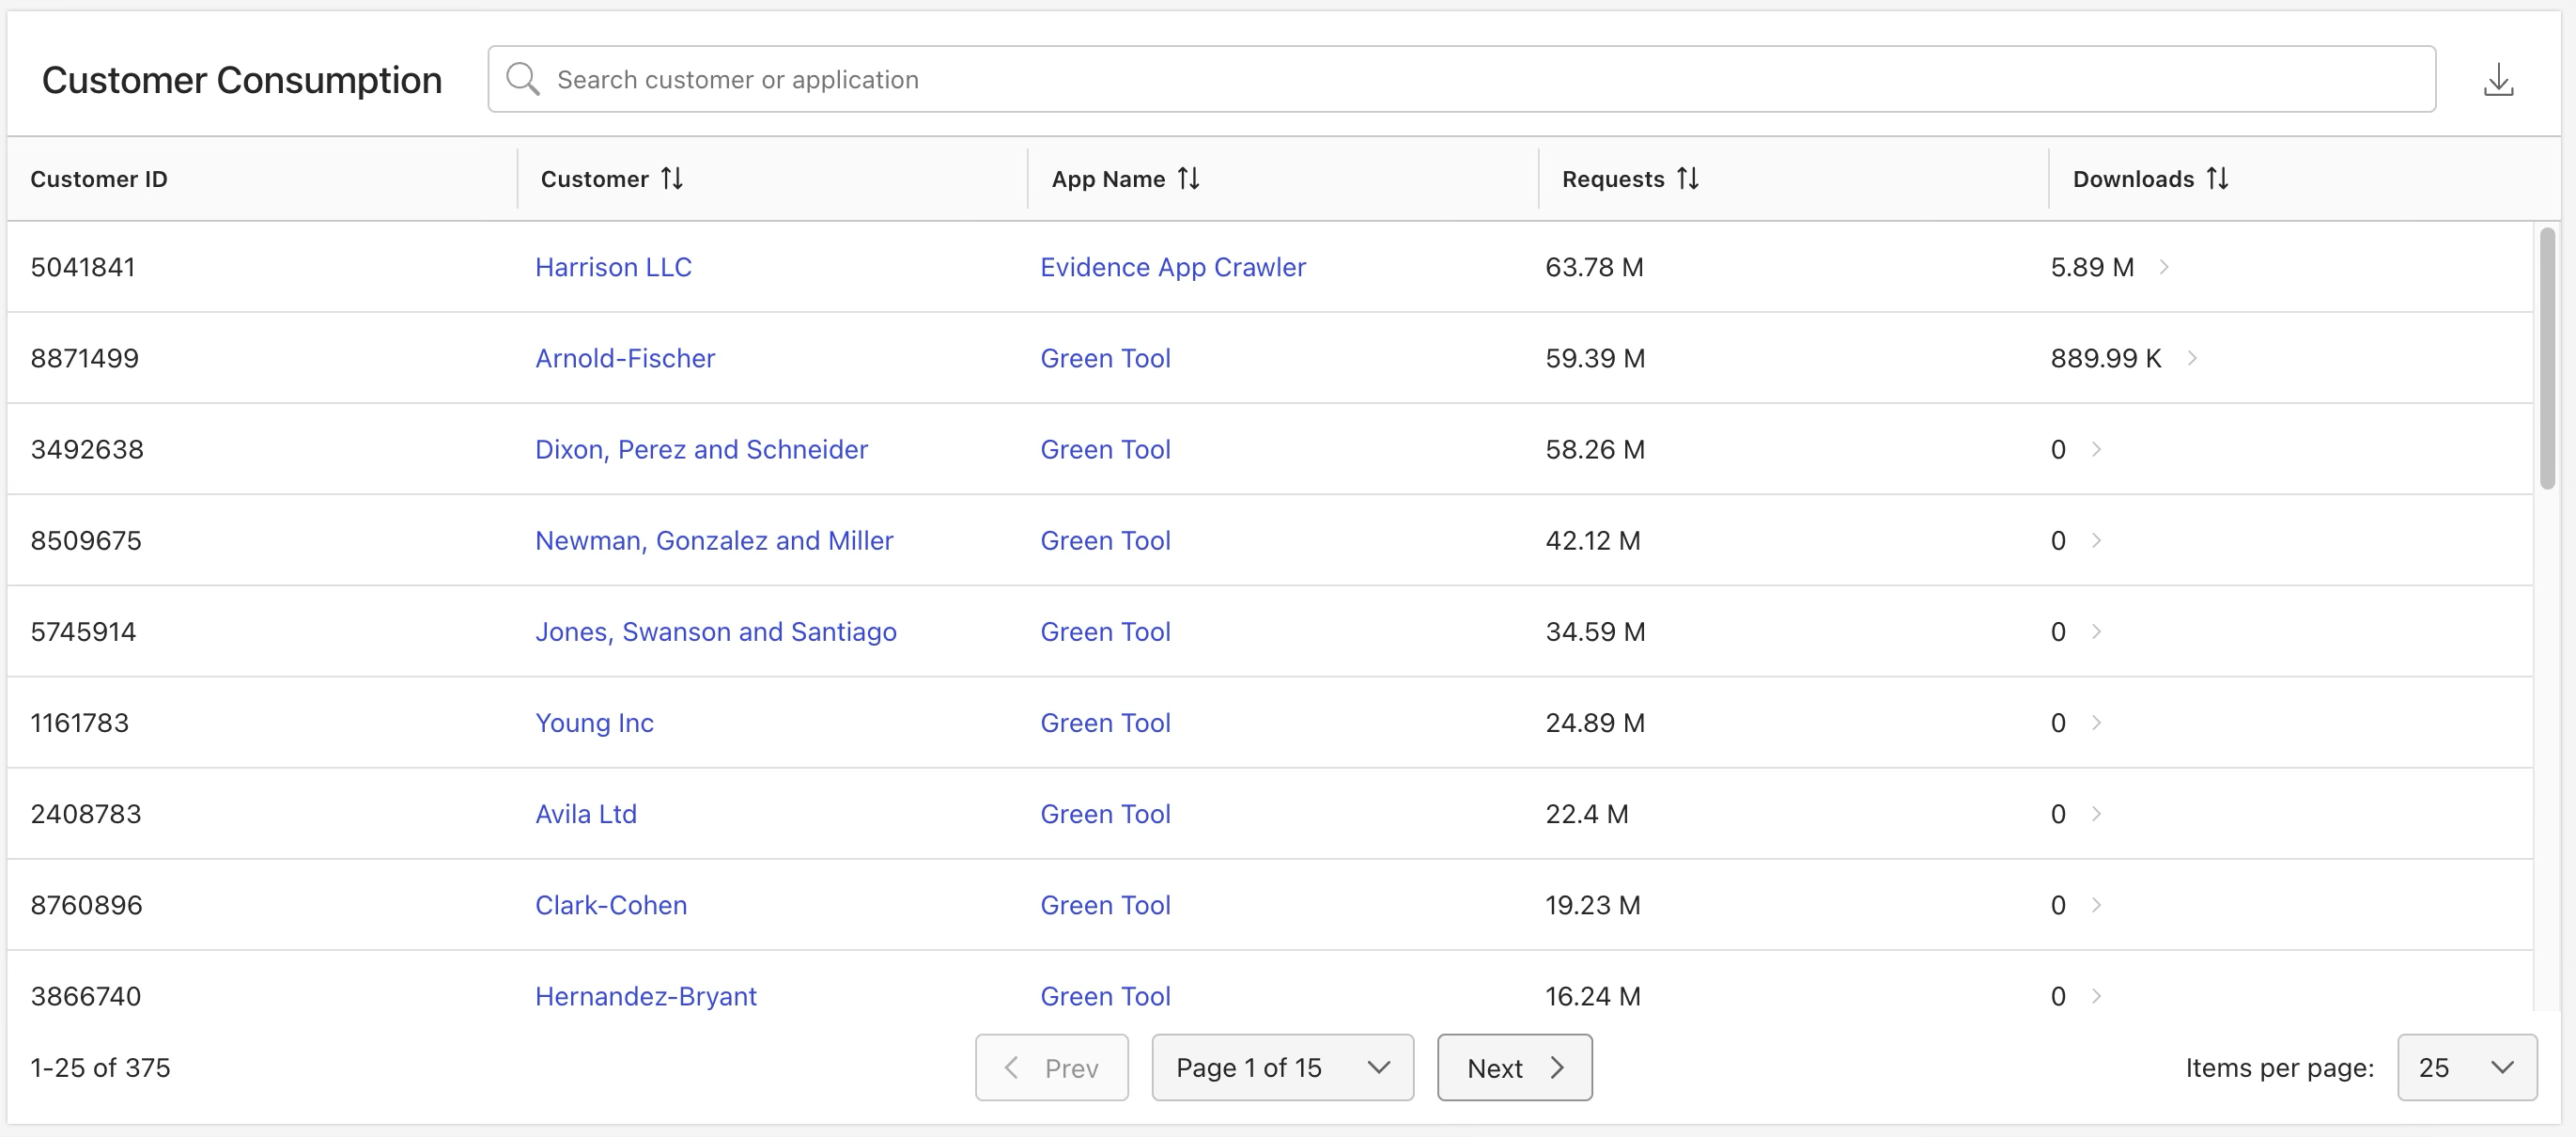
The following tiles summarize usage across your iManage Cloud customer environments:
Requests: Total application requests from all customers during the selected period.
Downloads: Total application downloads from all customers during the selected period.
Application Requests Total: Total requests for each application across all customers during the selected period.
Application Downloads Total: Total downloads for each application across all customers during the selected period.
Customer Requests Total: Total application requests for each customer during the selected period.
Customer Downloads Total: Total application downloads for each customer during the selected period.
Customer Consumption: Total application requests and downloads for each customer during the selected period.
Each tile shows summary data for the selected period. Additionally, several tiles let you download the underlying details or open a detailed report. In the detailed report, you can refine the scope and adjust the date range.
This section includes the following topics:
Accessing the Usage Analytics page
To view the Usage Analytics page in iManage Admin Portal:
Go to https://cloudimanage.com/admin/ and sign in with your iManage credentials.
Browse to Partner App Analytics > Usage Analytics.
NOTE: To view the Partner App Analytics section, the user account used to sign in to iManage Admin Portal must be assigned either the Partner App Analytics Admin or Viewer role. For more information about granting user access, refer to Access Policy.
An example of the Usage Analytics page is shown in the figures below.
Usage Analytics page actions
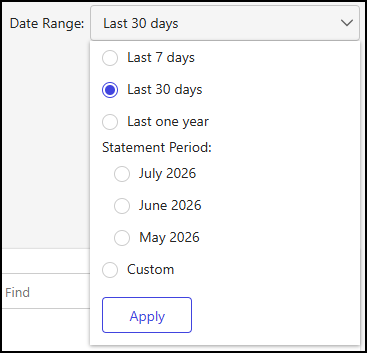
The Usage Analytics page includes a Date Range drop-down list, which lets you select the period for which you want to view request and download data for applications and customers. The following options are available:
Last 7 days
Last 30 days
Last one year
Statement Period
Custom
NOTES:
The Last 30 days option is selected by default.
The Statement Period section includes an option for each month in which data is available.
When you select Custom, the From and To date picker fields will display. Use these fields to choose your desired date range.
To change the date range for generating output on the Usage Analytics page, select the Date Range drop-down list, choose an option, and then select Apply.
For more information about the Usage Analytics dashboard tiles and the detailed reports you can create, refer to the following sections: