The Behavior Analytics Alert List dashboard provides a consolidated view of alerts across Behavior Analytics Rules of type Continuous and Scheduled. Alerts are presented independently of the rules which generated them. You can open a specific alert directly from a notification email using the Open Alert link; the link opens the alert’s Alert Details view.
The Behavior Analytics Alert List dashboard is accessible at any time, updates automatically, displays alert attributes, and provides numerous options for drill-down, filtering, and review of any alerts generated.
Alerts displayed on the Behavior Analytics Alert List are at times called Addressable Alerts in this documentation.
NOTE: Alerts generated by rules of type Run Once are incorporated into Reports, which can be viewed on the Behavior Analytics > Reports dashboard. Alerts generated by such rules aren't presented in the Behavior Analytics Alert List.
Addressable Alerts are listed on a per-user basis for each user with a threat level of (by default) Elevated or above. Detailed activity and risk scoring data is also presented for each alert, along with other pertinent information.
An addressable alert is generated when a user's activity count on a given day exceeds the group threshold value for an activity. If their activity count also exceeds their individual threshold, then the Risk Score of the alert is increased accordingly. On a calendar day, only one alert per user per monitoring rule is generated. However, the alert can get updated multiple times if there are additional deviations during the day for the same combination. For example, on Day 1, for a combination of User 1 and Rule 1, only one alert is generated. But on the same day, for the same user, if the monitoring rule differs, another alert is generated.
Examples:
Day 1:
Alert 1: User 1 and Rule 1
Alert 2: User 2 and Rule 1
Alert 3: User 1 and Rule 2
Day 2:
Alert 1: User 1 and Rule 2
Alert 2: User 2 and Rule 1
Alert 3: User 2 and Rule 2
NOTE: For more information on risk scoring, on how thresholds are generated and used, refer to What are Risk Scores and how are they calculated?, What is a threshold value? and corresponding questions in Understanding thresholds and risk scores.
In this section:
- Accessing and using the Behavior Analytics Alert List
- Accessing the Behavior Analytics Alert List
- Using the Behavior Analytics Alert List
- Viewing and sorting information displayed on the Behavior Analytics Alert List
- Hiding or showing activity columns
- Reviewing, flagging, and commenting on the Behavior Analytics Alert List
- Train/override the robot (applies in exceptional cases only)
- Filtering the Behavior Analytics Alert List
- Downloading the Behavior Analytics Alert List
- Drilling down into a Behavior Analytics Alert
Accessing and using the Behavior Analytics Alert List
Accessing the Behavior Analytics Alert List
You can access the Behavior Analytics Alert List dashboard by navigating to Behavior Analytics > Alert List from the Home Screen or the navigation bar.
NOTE: The Threat Manager application is highly responsive, so the arrangement of some items may differ from how they're described in this document if you're using a screen of narrow width, for example on a mobile device. All administrative functionality is, however, retained on such devices.
Using the Behavior Analytics Alert List
Viewing and sorting information displayed on the Behavior Analytics Alert List
The Behavior Analytics Alert List dashboard displays a list of alerts with the overall Risk Score and activity information for each alert. When scrolling, the headers remain visible, and a vertical scroll bar appears inside the table. A full‑screen button is available to expand the table for easier review.
NOTE: By default, a filter count of 2 is displayed to reflect the default filter criteria, namely Threat level Elevated and above and Review status Not Reviewed. If you don't see alerts on the dashboard, this may be a result of no alerts of threat level Elevated and above having been generated. In such case, update the filter to a lower threat level, such as Low and above.
The Risk Score is displayed in the leftmost column as a number inside a circle colored per the threat level for that score. Risk scores of up to 999 display numerically. Larger values use K, M, and B terminology and are rounded to the nearest decimal, for example a risk score of 1051 will display as 1.1k.
The Name of the user who generated the alert is displayed, along with the Date of the alert.
The Rule name is displayed along with the time and date when the rule last ran.
You can sort the Behavior Analytics Alert List by any of the named columns on the list. Select the name of the column to sort the list by the values in that column.
TIP: If you're a user with Role Manager role, the user names under Name are hyperlinked. Selecting the link takes you to the corresponding user page under the Configuration > Roles tab, where you can see additional information about that user.
The activity information is displayed as shown in the following table.
Activity | Explanation |
|---|---|
Document | Relates to the number of unique documents associated with the set of documents being assessed. |
<Relevant activities> | Individual activity counts for each activity shown. For more information about activities, refer to Activities. |
Client | Relates to the number of unique clients associated with the set of documents being assessed. |
Matter | Relates to the number of unique matters associated with the set of documents being assessed. |
The individual activity counts are presented as per the following data, or behavioral states:
No information: No number is displayed for this activity because it doesn't form part of the rule.
Normal behavior: A number (which may be 0) is presented with a white background, indicating that the user hasn't behaved unusually for this activity.
Unusual behavior: A number is presented with a gray background, indicating that the user has behaved differently for this activity from their peer group, resulting in this alert being generated.
Very unusual behavior: A number is presented with a colored background when the user has behaved differently from their peer group and from how they have behaved in the past, resulting in the risk score for this alert being increased. The colors range from yellow (less unusual) to red (most unusual). In this case, the numbers are underlined.
TIP: You can access this color-coding information in the Behavior Analytics Alert List by selecting Help me understand this page, at the foot of the list.
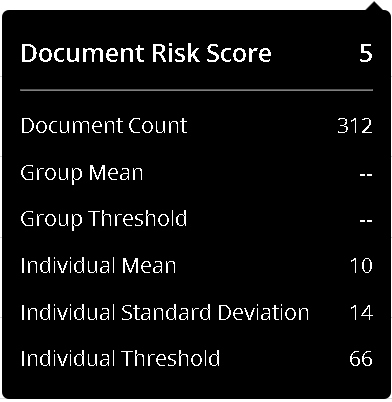
If Ignore Group Thresholds has been enabled for a particular rule, activity details for any alerts associated with that rule show "--" for Group Mean and Group Thresholds, per the following figure.
Figure: Example of Alert activity details for a rule with Ignore Group Thresholds enabled
Display of past period alerts
If there are any past-period alerts in the Behavior Analytics Alert List, a banner is displayed at the top of the Behavior Analytics Alert List.
Figure: example of banner displaying past period alert information

When you select View or the hyperlinked text, the Behavior Analytics Alert List is filtered to show only the new past period alerts; other filters are cleared and the date range of the list also changes to reflect the first and last dates of the new past period alerts. This automatically filtered list supports additional filtering.
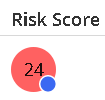
To ensure acknowledgment of past period alerts, and for ease of visibility, such alerts are always highlighted with a blue dot on their risk score. The blue dot is cleared when the alert is drilled into, or marked as reviewed.
Figure: example of new past period alert identified in the Behavior Analytics Alert List with a blue dot
Hiding or showing activity columns
You can refine the list of activities displayed. By default, all the activities are displayed. Note that the Risk Score, Name, and Date columns are always shown and can't be hidden.
Select the Settings icon in the header row and hide/show activities as required. The dashboard updates to display only the activities that you choose to view.
TIP: Hovering over an activity count displays a tooltip which shows the risk score and additional information associated with that activity count. You can use this to understand how the activity count contributes to the overall Risk Score for that alert.
The information displayed is as follows: Risk Score; Activity Count; Group Mean; Group Threshold; Individual Mean—Individual Standard Deviation, and Individual Threshold.
Reviewing, flagging, and commenting on the Behavior Analytics Alert List
The following statuses/options for an alert are also displayed:
Icon | Review Status |
|---|---|
 | To be Reviewed. This is the default status. If you have reviewed the alert, select this icon to mark it as reviewed and remove it from the alert list. |
| Reviewed. This icon indicates that the alert has been reviewed. Note that this icon appears momentarily, before the alert is cleared from the alert List. |
 | Not Flagged. Select this icon in the row of the alert to flag it. You may want to flag an alert to mark it for review later or to give it a higher importance when compared to other alerts. |
| Flagged. Select this icon to remove the flag. |
 | Select this icon in the alert row to open the Add Comment dialog. Enter alert-specific details (for example, investigation performed, findings, and inferences) that may aid future investigations and prevent duplication. You can add multiple comments. The Comment field supports up to 2,000 characters, including hyperlinks. Comments are clickable and open in a pop-up window for full-text viewing. |
 | This icon indicates that there are comments added to this alert. |


TIP: You can adjust the placement of the actions column on the alert list if required, to ensure that this is always readily available, regardless of your device or screen real estate. Refer to Adjusting column visibility and layout.
Train/override the robot (applies in exceptional cases only)
In the rare occurrence that an activity flagged as anomalous for a specific user by the iManage Threat Manager robot is in fact an allowed behavior, you can override the robot by marking that activity as normal for that user.
Henceforth, the robot will count such activity as normal for the user. When that user shows such a pattern in the future, it'll reduce the severity of the alert.
For applicable alerts, in which outlying behavior has been flagged, the Robot icon is lit up in the Actions: section in the top-right part of the page, as shown:

To review behavior, and if required, mark flagged behavior as normal:
Select the Robot icon. The Train Robot dialog appears.
The anomalous behavior detected in the alert is displayed on a per-activity basis. To mark any of these as normal, move the Is it Normal? slider to the right (Yes). Alternatively, select All NO or All YES.
(Optional) Add a comment explaining why this activity isn't anomalous.
Select Save. The robot will consider the specified behaviors as normal, and when the user shows such a pattern in the future, it'll reduce the severity of the alert.
You can review and if required, remove any Robot training inputs added. For more information, refer to Robot Training Inputs tab in the Configuration > Settings section of iManage Threat Manager Administration Help.
Filtering the Behavior Analytics Alert List
You can refine the list of Behavior Analytics Alerts displayed by entering a rule name string in the search box. You can also refine the displayed list using the Filter drop-down menu and make the necessary selections. You also have the option to download the list with filters applied. For additional information, refer to Downloading the Behavior Analytics Alert List.
By default, a filter count of 2 is displayed to reflect the default filter criteria, namely Threat level Elevated and above and Review status Not Reviewed. If you don't see alerts on the dashboard, this may be a result of no alerts of threat level Elevated and above having been generated. In such case, update the filter to a lower threat level, such as Low and above.
TIP: You can Pin or Unpin the filter list as required.
Filter | Explanation |
|---|---|
Reviewed | By default, reviewed alerts aren't displayed. The reviewed alerts remain visible on the page until the page is refreshed. Select Yes for continued display of reviewed alerts. |
Rule | By default, all alerts in the scope of the risk score selected are displayed. You can refine the alert list to display rule-specific alerts by entering the rule name in the Find Rule box. You can also add rules to the Rule filter. You may want to do this if you have rules whose alerts you frequently analyze. Select To remove the rule from the filter list, in the Rule dialog, select the Three Dots icon next to the rule row, and select Remove, or select X next to the rule on the filter panel above the list. |
Flagged | By default, all alerts are displayed. You can change the default setting by selecting (Flagged or Non Flagged), as required. |
Comments | By default, all alerts, with or without comments are displayed. You can change the default setting by selecting (With Comments or Without Comments), as required. |
Threat Level | By default, all alerts with a risk score of Elevated and above are displayed. You can change this default setting by selecting the required threat level. |
Alerts for Past Periods | By default, All alerts are displayed. Select New Alerts Only (to show the new alerts for past periods) within the page’s date range. Note that if you select View or the hyperlinked text on the past period alert banner, the list is filtered by New Alerts Only but the date range also changes to that of the first and last past period alerts generated; other filters are cleared. |
Downloading the Behavior Analytics Alert List
You can download the full Behavior Analytics Alert List, as a CSV, Microsoft Excel, or PDF file.
NOTE: The Behavior Analytics Microsoft Excel exports are single-sheet spreadsheets and don’t include the multi-sheet summary workbook format available in Detect and Protect and Compliance > Activity Report.
Browse to Behavior Analytics > Alert List and select an alert to open its Detail of Alert page.
Select the Download button to open its menu options.
Select Download as CSV, Download as EXCEL, or Download as PDF.
If filters have NOT been applied to the Alert List, then the download begins.
If filters HAVE been applied to the Alert List, then you have the option to download the Report with current filters applied, or the Full report.
Make your selection, then select OK.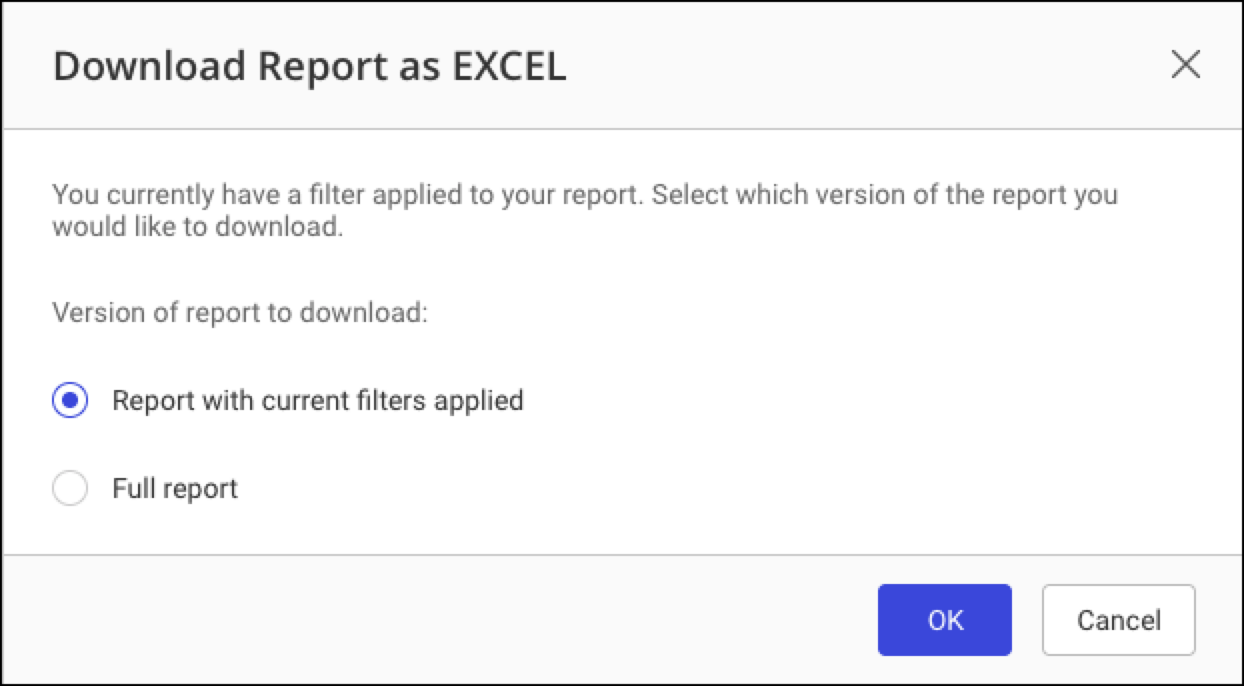
Drilling down into a Behavior Analytics Alert
You can drill down into an alert by selecting it in the alert list. This enables you to investigate further into the cause of an alert, and to view all of the details of that alert.
On the alert drill-down page, all document metadata and activity performed by the user associated with that alert is presented.
The following elements are presented:
Rule name and user details
When you drill down into an alert, the alert drill-down page is displayed, with the rule name for that alert at the top left of the page.
The name of the user is also displayed, along with additional details about the user to assist in investigation. Hover over the user's name to view the following information:
Full Name, Username, Is External, Account Status, Email Address, Location.
Any extended properties that have been added, for Manager, Additional Locations, Department, Practice Area, Telephone or Job Title.
Alert Summary and IP details (header)
Alert summary
An alert summary is presented as a header on the alert drill-down page. This summary shows the alert information as it is displayed on the main Alert List, but with an additional column, IP Address | Hostname, which provides a summary of where the documents were accessed from.
IP Address | Hostname
The IP Address | Hostname column shows the public-facing IP address(es), or hostname(s), from which the user's activity originated, along with the number of IP Addresses that there's been activity across.
This provides an investigator with visibility into whether export activity originated from one or more IP addresses. Because these are public IP addresses, they can be mapped to geographic locations to determine whether activity originated from more than one location during a time frame in which it'd be physically impossible to travel between those locations, indicating that the user's credentials have been compromised.
You can filter the documents list by IP address or hostname—for example to provide quick visibility into any documents accessed by an IP address that may be associated with compromised credentials. For more information, refer to Filtering activities and adjusting column visibility.
NOTE: This ability is supported with the iManage Work 10 Web and Desktop clients.
Alert Actions
You can update the flag status and review the status of the alert, and add comments if required, using alert Actions in the top right corner of the alert drill-down page.
For more details on the actions available, refer to Reviewing, flagging, and commenting on the Behavior Analytics Alert List.
Documents tab
When you open the Behavior Analytics Alert Details page, the Detail of Alert panel displays the Documents tab, by default. When scrolling, the headers remain visible, and a vertical scroll bar appears inside the table. A full‑screen button is available to expand the table for easier review.
This tab lists all documents associated with the alert and includes:
Document details
Metadata such as custom 1–16, 29, 30, class, and sub-classes.User activity
Actions the user performed on each document during the alert periodAccess information
How and when the document was accessed.
By default, the Documents table displays only document activities that match the Rule Criteria for the alert. For example, if the alert was triggered by a rule involving activities such as View, Mail, Export from DMS, and Checkout, only those activities will appear initially.
You can still display additional columns that aren’t specified in the rule criteria by selecting the Settings icon.
In the table, the following columns are always included and can't be removed:
Library
Doc. Number
Version
Document
Client
Custom1 Description
Matter
Custom2 Description
IP Address | Hostname
Other columns vary based on the applied column visibility settings. For example, document Author and Operator can be included or hidden.
You can export all document and activity details for an alert as a CSV, Excel (.XLSX), or PDF file.
Filtering activities and adjusting column visibility
Filtering activities
You can refine the list of documents shown by entering a document name string in the search box, and refine the details of the documents shown using the Filter drop-down menu. You can also download the list with these filters applied if required—refer to Exporting document details and activity information for the alert.
To access the filters, select the Filter icon.
Filter | Explanation |
|---|---|
Activity | By default, all document activities are displayed. Select or deselect activities as required. |
IP Address | Hostname | By default, all IP addresses and hostnames that a document was accessed from, are displayed. You can filter by a specific IP address or hostname, by using the Find IP Address | Hostname search filter. |
Custom fields | By default, all custom fields are displayed. Select or deselect custom fields as required. |
TIP: You can Pin or Unpin the filter list as required.
Adjusting column visibility
You can also adjust the visibility of columns in the documents list as required.
Select the Settings icon to adjust which columns are visible. Note that some columns, such as document names, are always shown and can't be hidden.
When columns are hidden/show with this feature, or resized using the column grab handles, you also have an option to Reset the columns to their default visibility and layout.
NOTE: The Reset feature returns both column visibility and any custom column widths to their default settings.
Exporting document details and activity information for the alert
You can export Documents details for the selected Behavior Analytics Alert to a CSV, Excel, or PDF file and save it on your local file system.
The exported file provides details on all documents accessed by a user for that alert, including associated activities on those documents. Document metadata (custom 1–16, 29, 30, class, and sub-class) is also exported. Any filters applied can be optionally included in the export.
You can download the full Behavior Analytics Alert List as a CSV, Excel, or PDF file.
Browse to Behavior Analytics > Alert List and select an alert to open its Detail of Alert page.
In the Documents tab, select the Download button to open its menu options.
Select Download as CSV, Download as EXCEL, or Download as PDF.
If filters have NOT been applied to the Alert List, then the download begins.
If filters HAVE been applied to the Alert List, then you have the option to download the Report with current filters applied, or the Full report.
Make your selection, then select OK.
Trends (tab)
Overview, and types of activity chart in, Trends tab
The Trends tab is available on the alert drill-down page, in the Detail of Alert panel.
The selected Behavior Analytics Alert’s risk score, user name, user ID, and the date of alert generation are displayed in the title bar just above the Activity charts. If a User Name isn't defined, then only the User ID is displayed.
The following charts are available:
Activities chart: This chart represents the counts of different activities in which the user showed abnormal behavior during the day. You can select the activities you wish to display in the chart by clicking the relevant activity on the activities bar located on the right-hand side of the activity chart. To go back one level after drill-down, select Back.
Clients histogram: This is a bar graph that represents the number of clients where the user showed abnormal behavior during the day. You can drill down on the Clients histogram to get the client name and corresponding activity count for the client where the user deviated from the norm on a given day. To go back one level after drill-down, select Back.
Matters histogram: This is a bar graph that represents the number of matters where the user showed abnormal behavior during the day. You can drill down on the Matters histogram to get the matter name, and corresponding client name and activity count for the matter where the user deviated from the norm on a given day. To go back one level after drill-down, select Back.
Documents histogram: This is a bar graph that represents the number of unique documents accessed by the user where they showed abnormal behavior during the day. You can drill down on the Documents histogram to get the document name, and the corresponding client name, matter name, and the activity count. To go back one level after drill-down, select Back.
TIP: The Activities chart displays a Day of alert label, for ease of reference. The Clients, Matters, and Documents histograms also display a Day of alert label, but only when a drill-down has been performed to the day level (and the day of alert is within the range of the drilled-down chart).
Expand or contract the date range displayed in Trends tab activity charts
You have the option to expand (or contract) the date range displayed on the activity charts, to provide a wider (or narrower) chronological context for the alert.
At the top right of the activity charts, enter a number into, or use the arrows to adjust, the Days before alert field.
Each of the activity charts is immediately updated with the adjusted date range.
You can extend the date range to a maximum of 90 days before the alert.At the top right of the activity charts, enter a number into, or use the arrows to adjust, the Days after alert field.
Each of the activity charts is immediately updated with the adjusted date range.
You can extend the date range to any number of days after the alert, up to the present date.
Exporting activity charts
You can export Clients, Matters, or Documents activity information for the selected user into a CSV, Excel, or PDF file and save it on your local file system.
Browse to Behavior Analytics > Alert List and select an alert to open its Detail of Alert page.
In the Trends tab, select the Download button beneath the Clients, Matters, or Documents chart.
Select Download as CSV, Download as EXCEL, or Download as PDF.
The selected file is saved to your local file system and contains details on:The documents, matters, or clients accessed by a user on a given day within the specified time range.
The user’s activities related to those documents, matters, or clients.
The document types, Client IDs, Matter IDs, and other related data.
Rule Details (tab)
From the alert drill-down page, in the Detail of Alert panel, select the Rule Details tab.
This displays the Behavior Analytics Rule Summary, and the Thresholds Summary (as displayed in the Rule Details tab of a Behavior Analytics Rule).