iManage Threat Manager Matter Activity reports provide detailed insights into user actions related to clients and matters (such as cases or projects). These reports support compliance, auditing, and investigations by capturing who did what, when, and where within the system.
This section explains how to navigate, understand, and act on Matter Activity reports in iManage Threat Manager. You’ll learn how to review user activity, analyze data using interactive charts, add comments, mark investigation status, and export reports.
In this section:
- About Matter Activity > Reports
- About the Matter Activity Reports dashboard
- About the Matter Activity report details page
- About charts in a Matter Activity report
- Adding comments to Matter Activity reports
- Setting the status of a Matter Activity report
- Exporting the Detail View table
- Exporting chart data for individual users or groups
About Matter Activity > Reports
Matter Activity reports help you investigate, audit, and monitor how users interact with sensitive client and matter content in iManage Work. These reports capture detailed activity (for example, document access, edits, and downloads), along with who performed each action and when. You can focus your review by filtering activity by user, client, time frame, or type of action.
Use these reports to identify unusual behavior, support compliance reviews, and document your investigative steps. You can add comments, mark the status of your review, and export data for further analysis or record keeping.
Key features
Track document and user activity: Identify who accessed, edited, or downloaded documents across client matters.
Monitor user behavior for compliance and investigations: See which users interacted with sensitive content, when they did it, and what actions they performed.
Generate audit-ready reports with date filtering: Filter data by time frame, user, client, or action type to focus on specific audit periods.
Document and manage investigative status: Flag reports or specific users under investigation, mark them as reviewed, and add context through comments.
Analyze trends with interactive charts: Use visual breakdowns of user activity by client, matter, document, and action type.
Export data for analysis or sharing: Download full activity tables or chart data in CSV, Microsoft Excel, or PDF format for offline analysis or reporting.
About the Matter Activity Reports dashboard
The Matter Activity Reports dashboard displays all reports generated for clients and matters, along with related activities over a specified period. Reports are created on a set schedule, even if no activity occurs during that time.
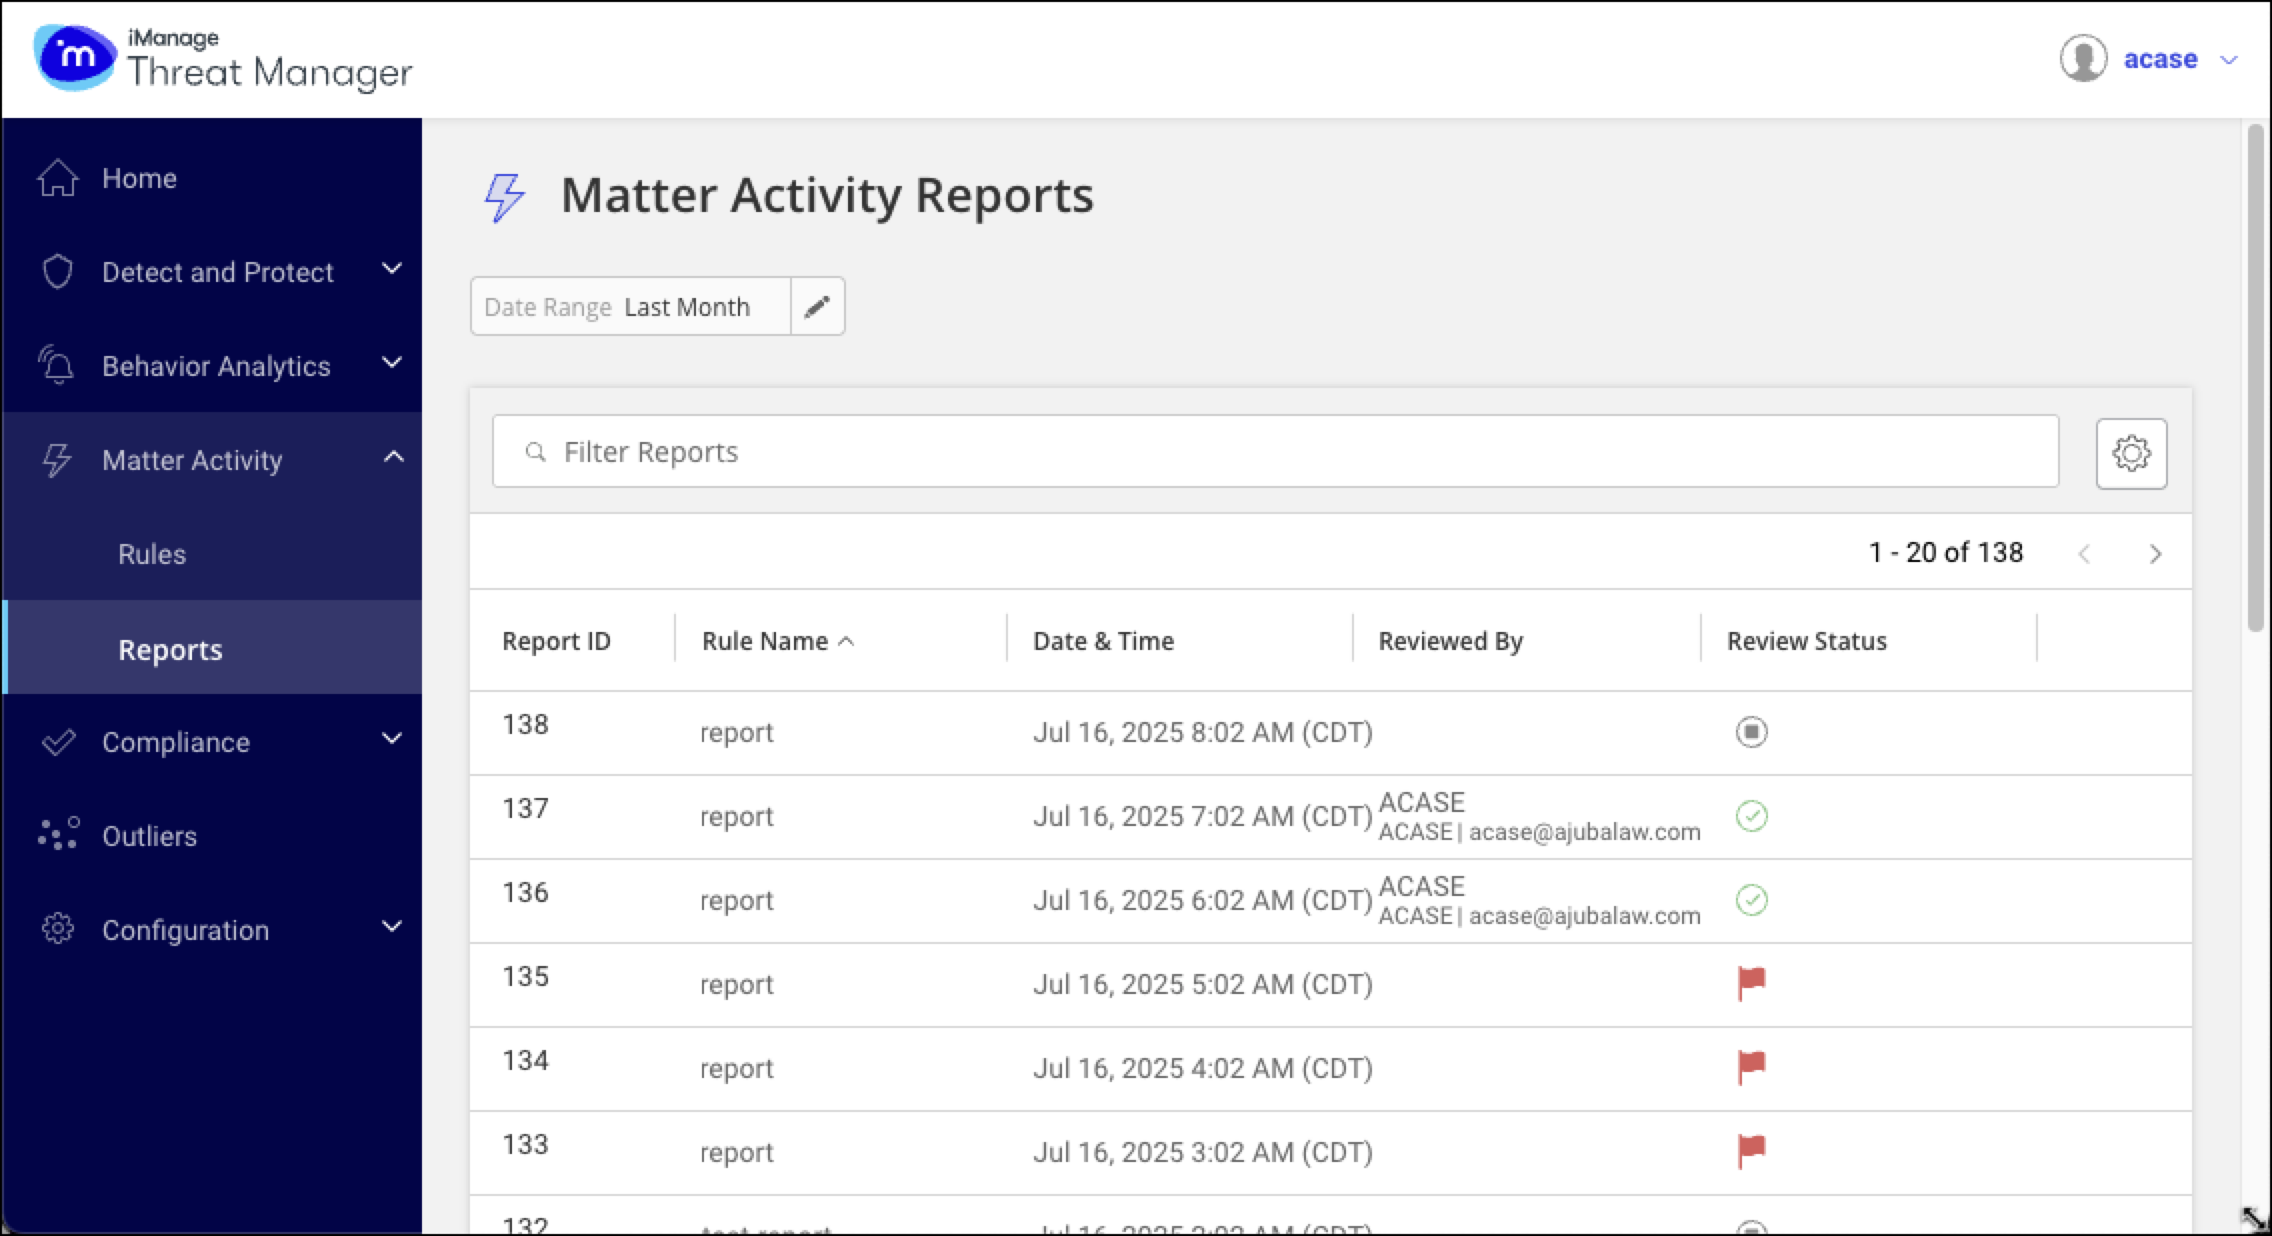
Report details in Matter Activity Reports dashboard
The Matter Activity Reports dashboard provides the following information for each report:
Report ID: Sequential system-generated ID.
Rule Name: Name of the Matter Activity Rule.
Date & Time: When the report was generated.
Reviewed By: User who reviewed the report.
Review Status: Status of the report, indicated by an icon:
 To Be Reviewed: Not yet examined
 Reviewed: Investigation completed or closed
 Flagged: Under investigation
Working with the Matter Activity Reports dashboard
By default, the dashboard displays the Matter Activity reports generated for Today. You can:
Filter the reports by Date Range (Most Recent, Last Week, Last Month, Last 3 Months, Last 6 Months, Last Year, or Custom dates) and keywords.
Sort the list by any column.
Click a report row to view its details page, which includes summary tiles with high-level metrics for the selected period.
NOTE: Reports are generated on schedule, even if no activity is detected.
View the Matter Activity Reports dashboard
To access the Matter Activity Reports dashboard, browse to Matter Activity > Reports from the Home screen or side navigation bar.
About the Matter Activity report details page
iManage Threat Manager Matter Activity reports provide an overview of user actions through summary tiles, detailed tables, and activity charts.
In this section:
Matter Activity report summary tiles
Detail View tab in a Matter Activity report
Detail View table in a Matter Activity report
View a Matter Activity report details page
Rule Details tab in a Matter Activity report
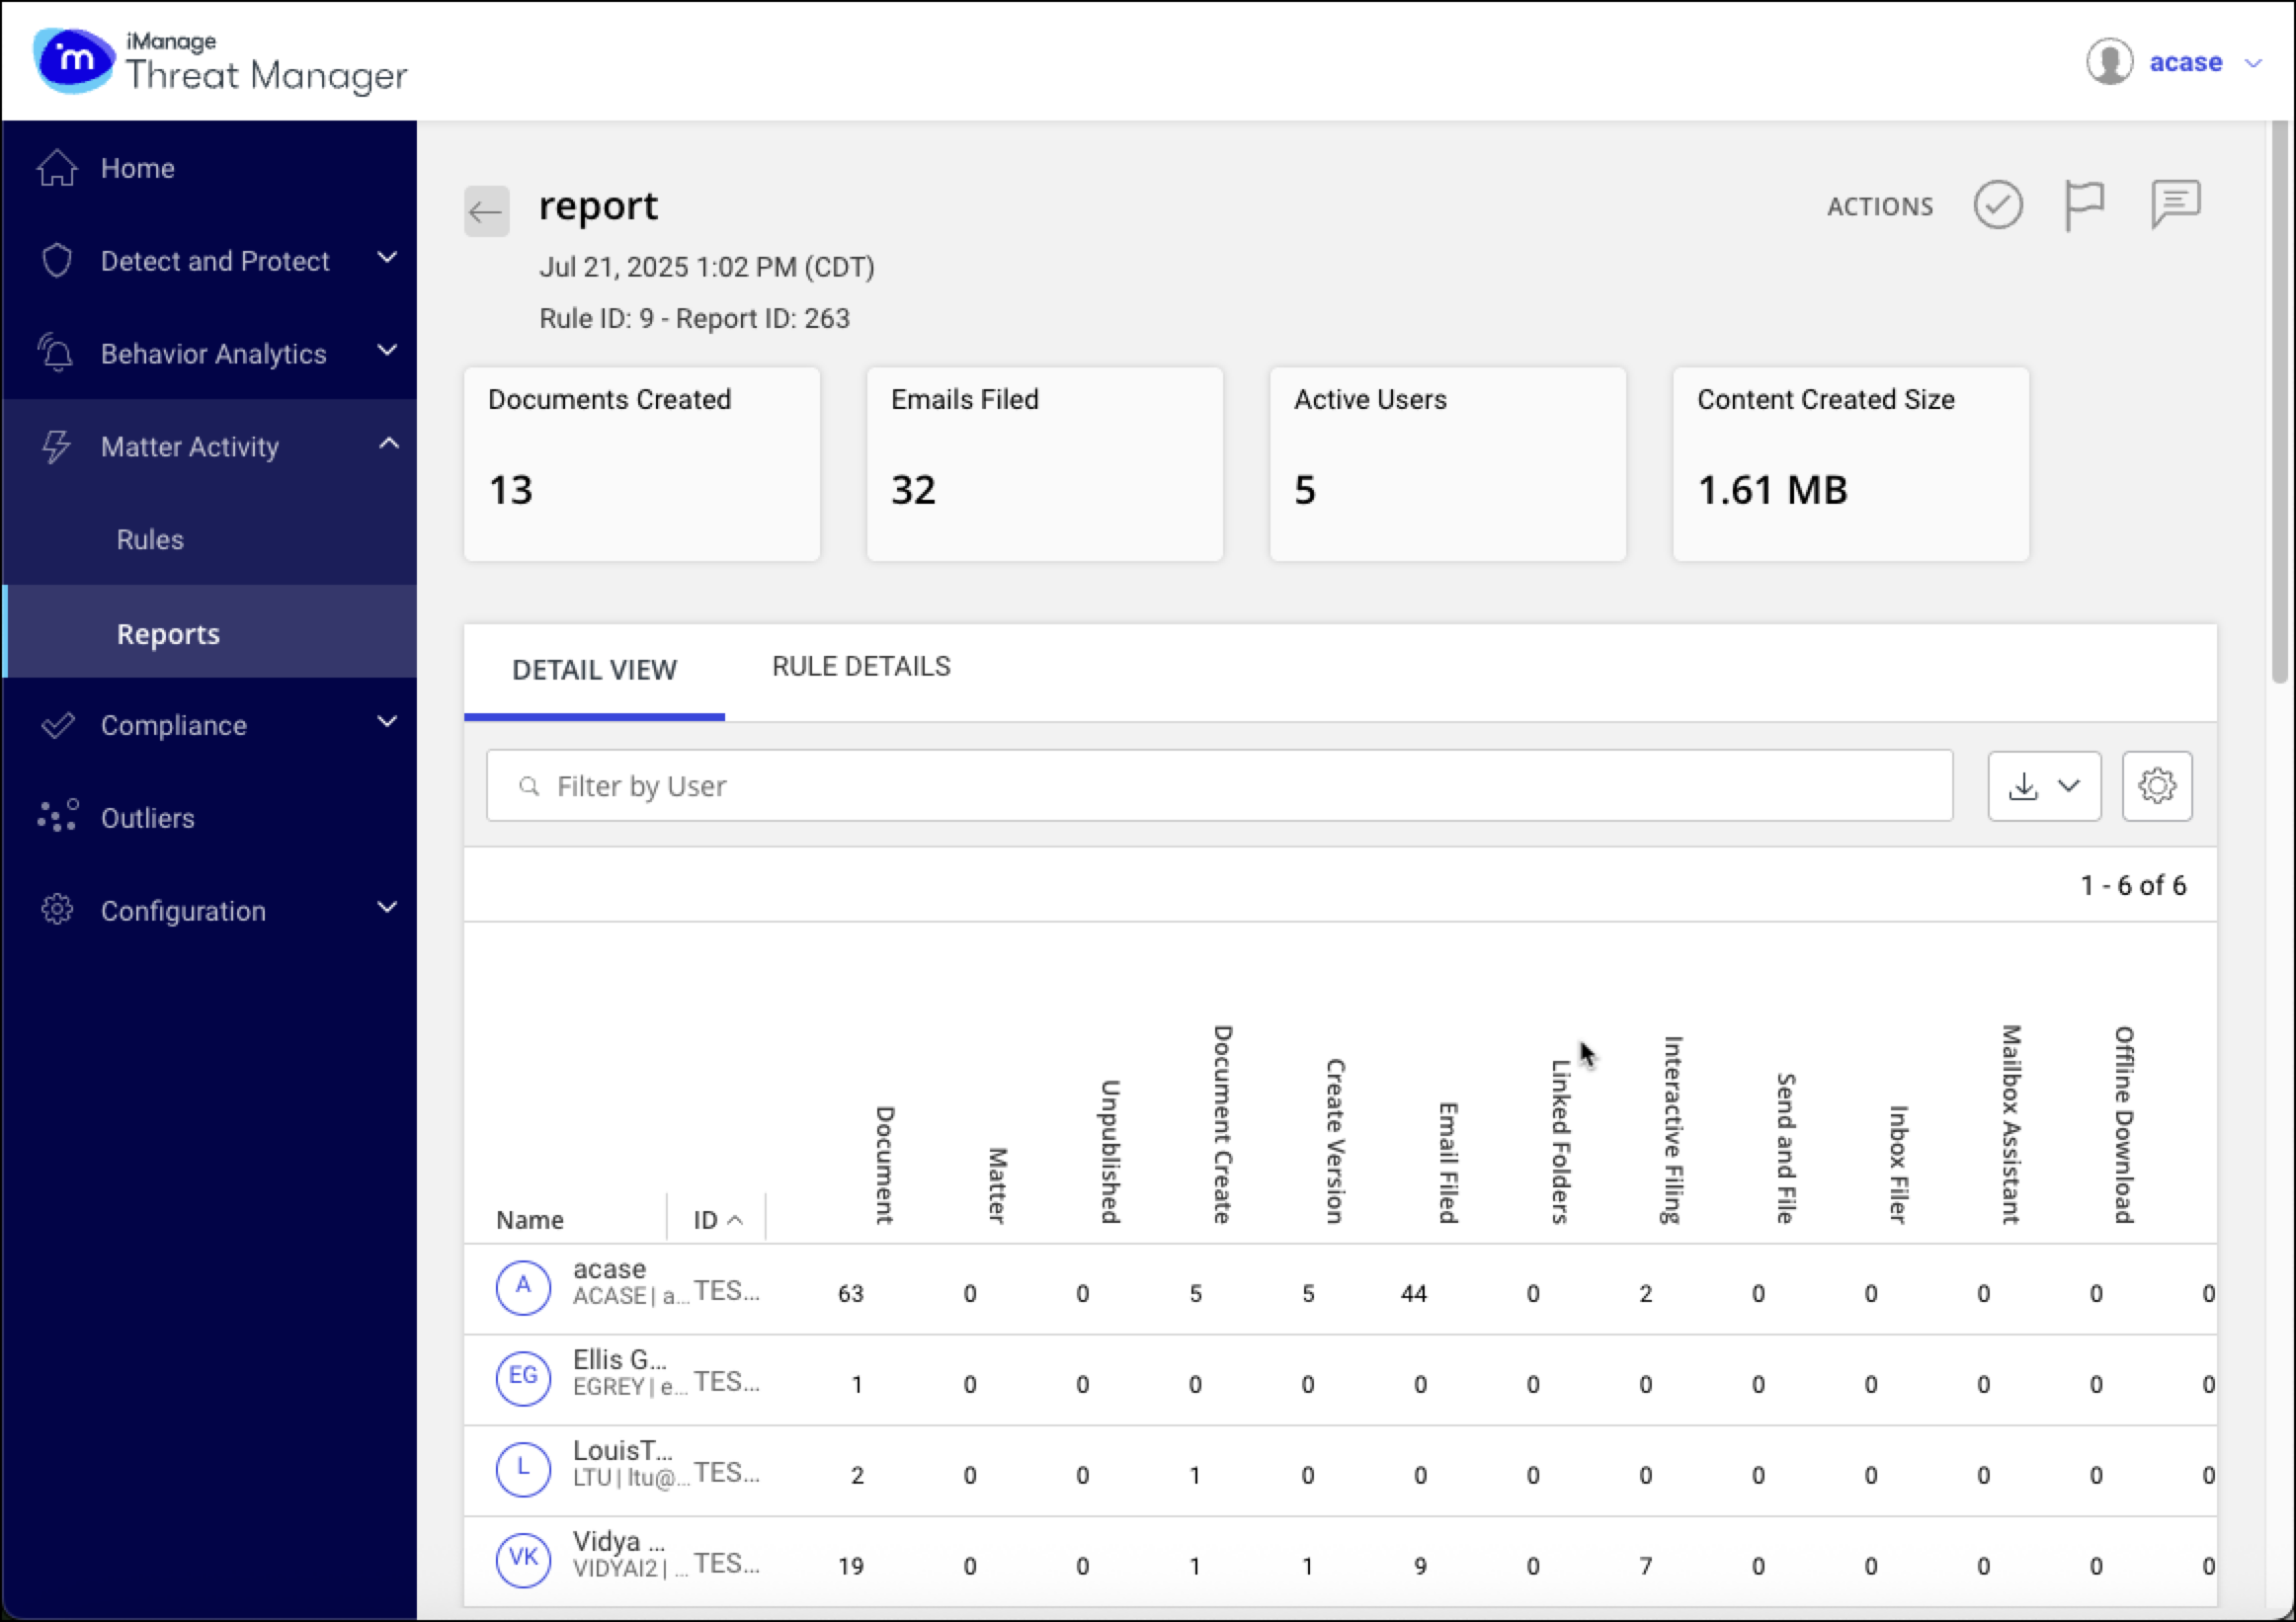
Matter Activity report summary tiles
When viewing a Matter Activity report from the Matter Activity > Reports dashboard, summary tiles appear at the top of the report details page. These tiles display key metrics for the selected date range and are visible when viewing the Detail View tab or the Rule Details tab.
Documents Created: Total number of documents and versions created by users defined in the activity rule.
Emails Filed: Total count of unique emails filed.
Active Users: Number of users who performed tracked activities.
Content Created Size: Combined size of all documents, versions, and emails created or filed.
Each tile includes a tooltip with context based on configuration settings. The values reflect activity at the time the report was generated.
Icons in the upper right corner of the report allow you to mark the report as Reviewed or Flagged, and add a Comment. Selecting the Comment icon opens the Add Comment dialog. (The Comment field supports up to 2,000 characters, including hyperlinks. Comments are clickable and open in a pop-up window for full-text viewing.)
IMPORTANT: Supervised Import (through API) considerations
Supervised import mode generates two entries in the iManage document history table: one attributed to the Admin who performed the import action, and one to the original user who performed the document activities. Both entries share the same document ID. This behavior is by design and can't be changed.
To ensure correct reporting and compliance tracking:
To avoid inflated metrics, exclude Admin users from the Compliance > Adoption Report, Matter Activity > Reports, and Trending Charts (when trending the Size of Imported Content).
The Content Created Size metric may be overstated due to duplicate entries generated by Admin activity during supervised imports.
To exclude Admin users from report metrics, use the Global Exclusions List or configure report filters to omit their activity.
To accurately reflect user activity in compliance audits, run a Compliance Adoption report with Admin users excluded.
Detail View tab in a Matter Activity report
Selecting a report in the Matter Activity > Reports dashboard opens its details page. This page includes summary tiles at the top, and tabs for Detail View (the default view) and Rule Details. In the Detail View, you can:
View detailed report and activity information.
Add comments.
Set the report status.
View granular details in multiple formats.
Detail View table in a Matter Activity report
The Detail View tab displays a table listing user activities related to the specified clients and matters within the selected time range. For each user, you can:
Hover over the ID column to see a tooltip with the Client and Matter name.
Select a user to view a graphical representation of the matters and documents accessed during the time period.
Add user-specific comments by clicking the Comment icon at the end of the user’s row. This opens the Add Comment dialog where you can add a comment.
The Comment field supports up to 2,000 characters, including hyperlinks. Comments are clickable and open in a pop-up window for full-text viewing.Flag individual users for further investigation.
View a Matter Activity report details page
To open a report details page:
Browse to Matter Activity > Reports from the Home screen or side navigation bar.
In the Matter Activity Reports dashboard, select a report from the list.
The report’s details page opens, showing summary tiles at the top and tabs for Detail View and Rule Details.
Rule Details tab in a Matter Activity report
The Rule Details tab provides a summary of the monitoring rule that triggered the report. This tab also displays the same summary tiles shown in the Detail View, providing consistent access to key metrics regardless of the tab you’re viewing.
To view the Rule Details tab:
Browse to Matter Activity > Reports and select the report in the dashboard. The report details page opens.
Select the Rule Details tab.
About charts in a Matter Activity report
When you select a user in the Detail View table, a set of activity charts appears at the bottom of the page. These charts remain visible as you switch between the Detail View and Rule Details tabs. For each chart, you can drill down to view additional information.
The charts include:
Clients bar chart: Displays the number of clients accessed per day during the analyzed period. Drill down and hover over the chart to view matter names, client names, and activity counts.
Matters bar chart: Shows the number of matters accessed per day. Drill down and hover over the chart to view matter names, client names, and activity counts.
Documents bar chart: Presents the number of documents accessed per day. Drill down for document names and IDs, client names, matter names, and activity counts.
Activities chart: Displays counts of different types of activities performed by the user during the selected period. Select one or more entries in the activities list to exclude or include them in the chart.
TIP: To return to the previous level after drilling down, select Back.
View user activity charts in a Matter Activity Report
When you select a user in the Matter Activity > Reports > Detail View table, a set of activity charts appears at the bottom of the page. These charts remain visible as you switch between the Detail View and Rule Details tabs.
To view user activity charts:
Browse to Matter Activity > Reports and select a report in the dashboard. The report details page opens.
In the Detail View tab, select a user from the activity table.
Charts showing the user’s activity are displayed at the bottom of the page. They include:
For each chart, you can drill down to view additional information.
To return to the previous level after drilling down, select the Back button.
Adding comments to Matter Activity reports
You can add comments about a Matter Activity report or any of the users included in a report.
Add comments to a Matter Activity report
To add a comment to a Matter Activity report:
Browse to Matter Activity > Reports and select a report in the dashboard. The report details page opens.
At the top right of the details page, select the Comment icon. The Add Comment dialog opens.
The Comment field supports up to 2,000 characters, including hyperlinks. Comments are clickable and open in a pop-up window for full-text viewing.Enter your comment, then select Add Comment.
The dialog closes and you’re returned to the Matter Activity report details view. The comment icon turns blue when a comment is present.
Add comments about a user in a Matter Activity report
To add a comment:
Browse to Matter Activity > Reports and select a report from the dashboard. The report details page opens.
In the Detail View tab, scroll to the end of the user’s row and select the Comment icon. The Add Comment dialog opens.
The Comment field supports up to 2,000 characters, including hyperlinks. Comments are clickable and open in a pop-up window for full-text viewing.Enter your comment, then select Add Comment.
The dialog closes and you return to the Matter Activity report details view. The comment icon turns blue when a comment is present.
Setting the status of a Matter Activity report
You can set the status of a Matter Activity report or any of the users included in a report. Status options from a report details view:
Icon | Review Status |
|---|---|
| Reviewed: Investigation completed or closed. |
| Flagged: Under investigation. |
Set the status of a Matter Activity report
To set the status of a Matter Activity report:
Browse to Matter Activity > Reports and select the report in the dashboard. The report details page opens.
At the top right of the details page, select a review status icon, either Reviewed or Flagged.
When selected, the Reviewed icon turns green and the Flagged icon turns red. When neither is selected, the Reviewed icon is gray and the Matter Activity Report dashboard displays the report’s status as To Be Reviewed.
Set the status of a user in a Matter Activity report
To set the status of a user in a Matter Activity report:
Browse to Matter Activity > Reports and select the report in the dashboard. The report details page opens.
In the Detail View tab, scroll to the end of the user’s row.
Click the gray Flagged icon to change it to red and indicate the user is under investigation. Click the icon again to change the user’s status to Reviewed and indicate the user investigation is complete.
Exporting the Detail View table
iManage Threat Manager provides options for exporting all user activity rows from the Detail View table. These exports are useful for archiving, offline analysis, or sharing comprehensive audit data. You can download the entire table in CSV, Microsoft Excel, or PDF format. Each export includes additional fields like iManage Drive Sync Count and Mobile Sync Count.
Export Detail View table as CSV
Browse to Matter Activity > Reports and select the report in the dashboard. The report details page opens.
In the Detail View table, click Download in the upper right corner.
From the drop-down menu, select Download as CSV.
The PDF file is saved to your local system with a standard file name. It includes additional columns for iManage Drive Sync Count (Go!Drive count) and Mobile Sync count.
Export Detail View table as Microsoft Excel
Matter Activity exports single-sheet Microsoft Excel spreadsheets and don’t include PivotTables or multi-sheet summary workbooks.
Browse to Matter Activity > Reports and select the report in the dashboard. The report details page opens.
In the Detail View table, click the Download button in the upper right corner.
From the drop-down menu, select Download as EXCEL.
The Excel (.XLSX) file is saved to your local system with a standard file name. It includes additional columns for iManage Drive Sync Count (Go!Drive count) and Mobile Sync count.
Export Detail View table as PDF
Browse to Matter Activity > Reports and select the report in the dashboard. The report details page opens.
In the Detail View table, click Download in the upper right corner.
From the drop-down menu, select Download as PDF.
The PDF file is saved to your local system with a standard file name. It includes additional columns for iManage Drive Sync Count (Go!Drive count) and Mobile Sync count.
NOTE: If the chart contains too many items, the PDF option may be unavailable. A tooltip will provide more information.
Exporting chart data for individual users or groups
In addition to exporting the full activity table, you can export chart data (Documents, Matters, or Client histograms) for a specific user or group. These visual summaries can be saved as CSV, Excel, or PDF files for focused reporting or investigation purposes. Exporting chart data is useful when separating activity trends by user, client, or matter.
Export chart data for a selected user or group as CSV
To export chart data (Documents, Matters, or Clients) for a specific user or group as a CSV file:
Browse to Matter Activity > Reports and select the report in the dashboard. The report details page opens.
In the Detail View table, select the user or group you want to export data for.
Scroll to the lower part of the page. Under the Documents, Matters, or Clients chart, select the Download button below the chart you wish to export.
From the drop-down menu, select Download as CSV.
The CSV file is saved to your local system with a standard file name.
Export chart data for a selected user or group as an Excel file
To export chart data (Documents, Matters, or Clients) for a specific user or group as an Excel file:
Browse to Matter Activity > Reports and select the report in the dashboard. The report details page opens.
In the Detail View table, select the user or group you want to export data for.
Scroll to the lower part of the page. Under the Documents, Matters, or Clients chart, select the Download button below the chart you wish to export.
From the drop-down menu, select Download as EXCEL.
The Excel (.XSLX) file is saved to your local system with a standard file name.
Export chart data for a single user or group as PDF
Browse to Matter Activity > Reports and select the report in the dashboard. The report details page opens.
In the Detail View table, select the user or group you want to export data for.
Scroll to the lower part of the page. Under the Documents, Matters, or Clients chart, select the Download button below the chart you wish to export.
From the drop-down menu, select Download as PDF.
The PDF file is saved to your local system with a standard file name.
NOTE: If the chart contains too many items, the PDF option may be unavailable. A tooltip will provide more information.