The Detect and Protect Alert List gives you a centralized, real-time view of all Detect and Protect alerts and their action status, with a separate entry per user regardless of which rule generated the alert. The list updates automatically. Using this page, you can review each alert’s activity, flag or comment on alerts for follow-up, filter and sort the list to focus on high-priority activity, and drill into an alert's details—including document activity, trends, and rule configuration—to investigate further.
In this section:
- View the Detect and Protect Alert List
- Review, flag, and comment on the Detect and Protect Alert List
- Sort and filter alerts in the Detect and Protect Alert List
- Task: Download the Detect and Protect Alert List
- View Detect and Protect alert details
- Exporting alert data to a multi-sheet Microsoft Excel summary workbook
- Download as EXCEL option: Available export formats
View the Detect and Protect Alert List
To view the Detect and Protect Alert List dashboard, browse to Detect and Protect > Alert List from the Home screen or the navigation bar.
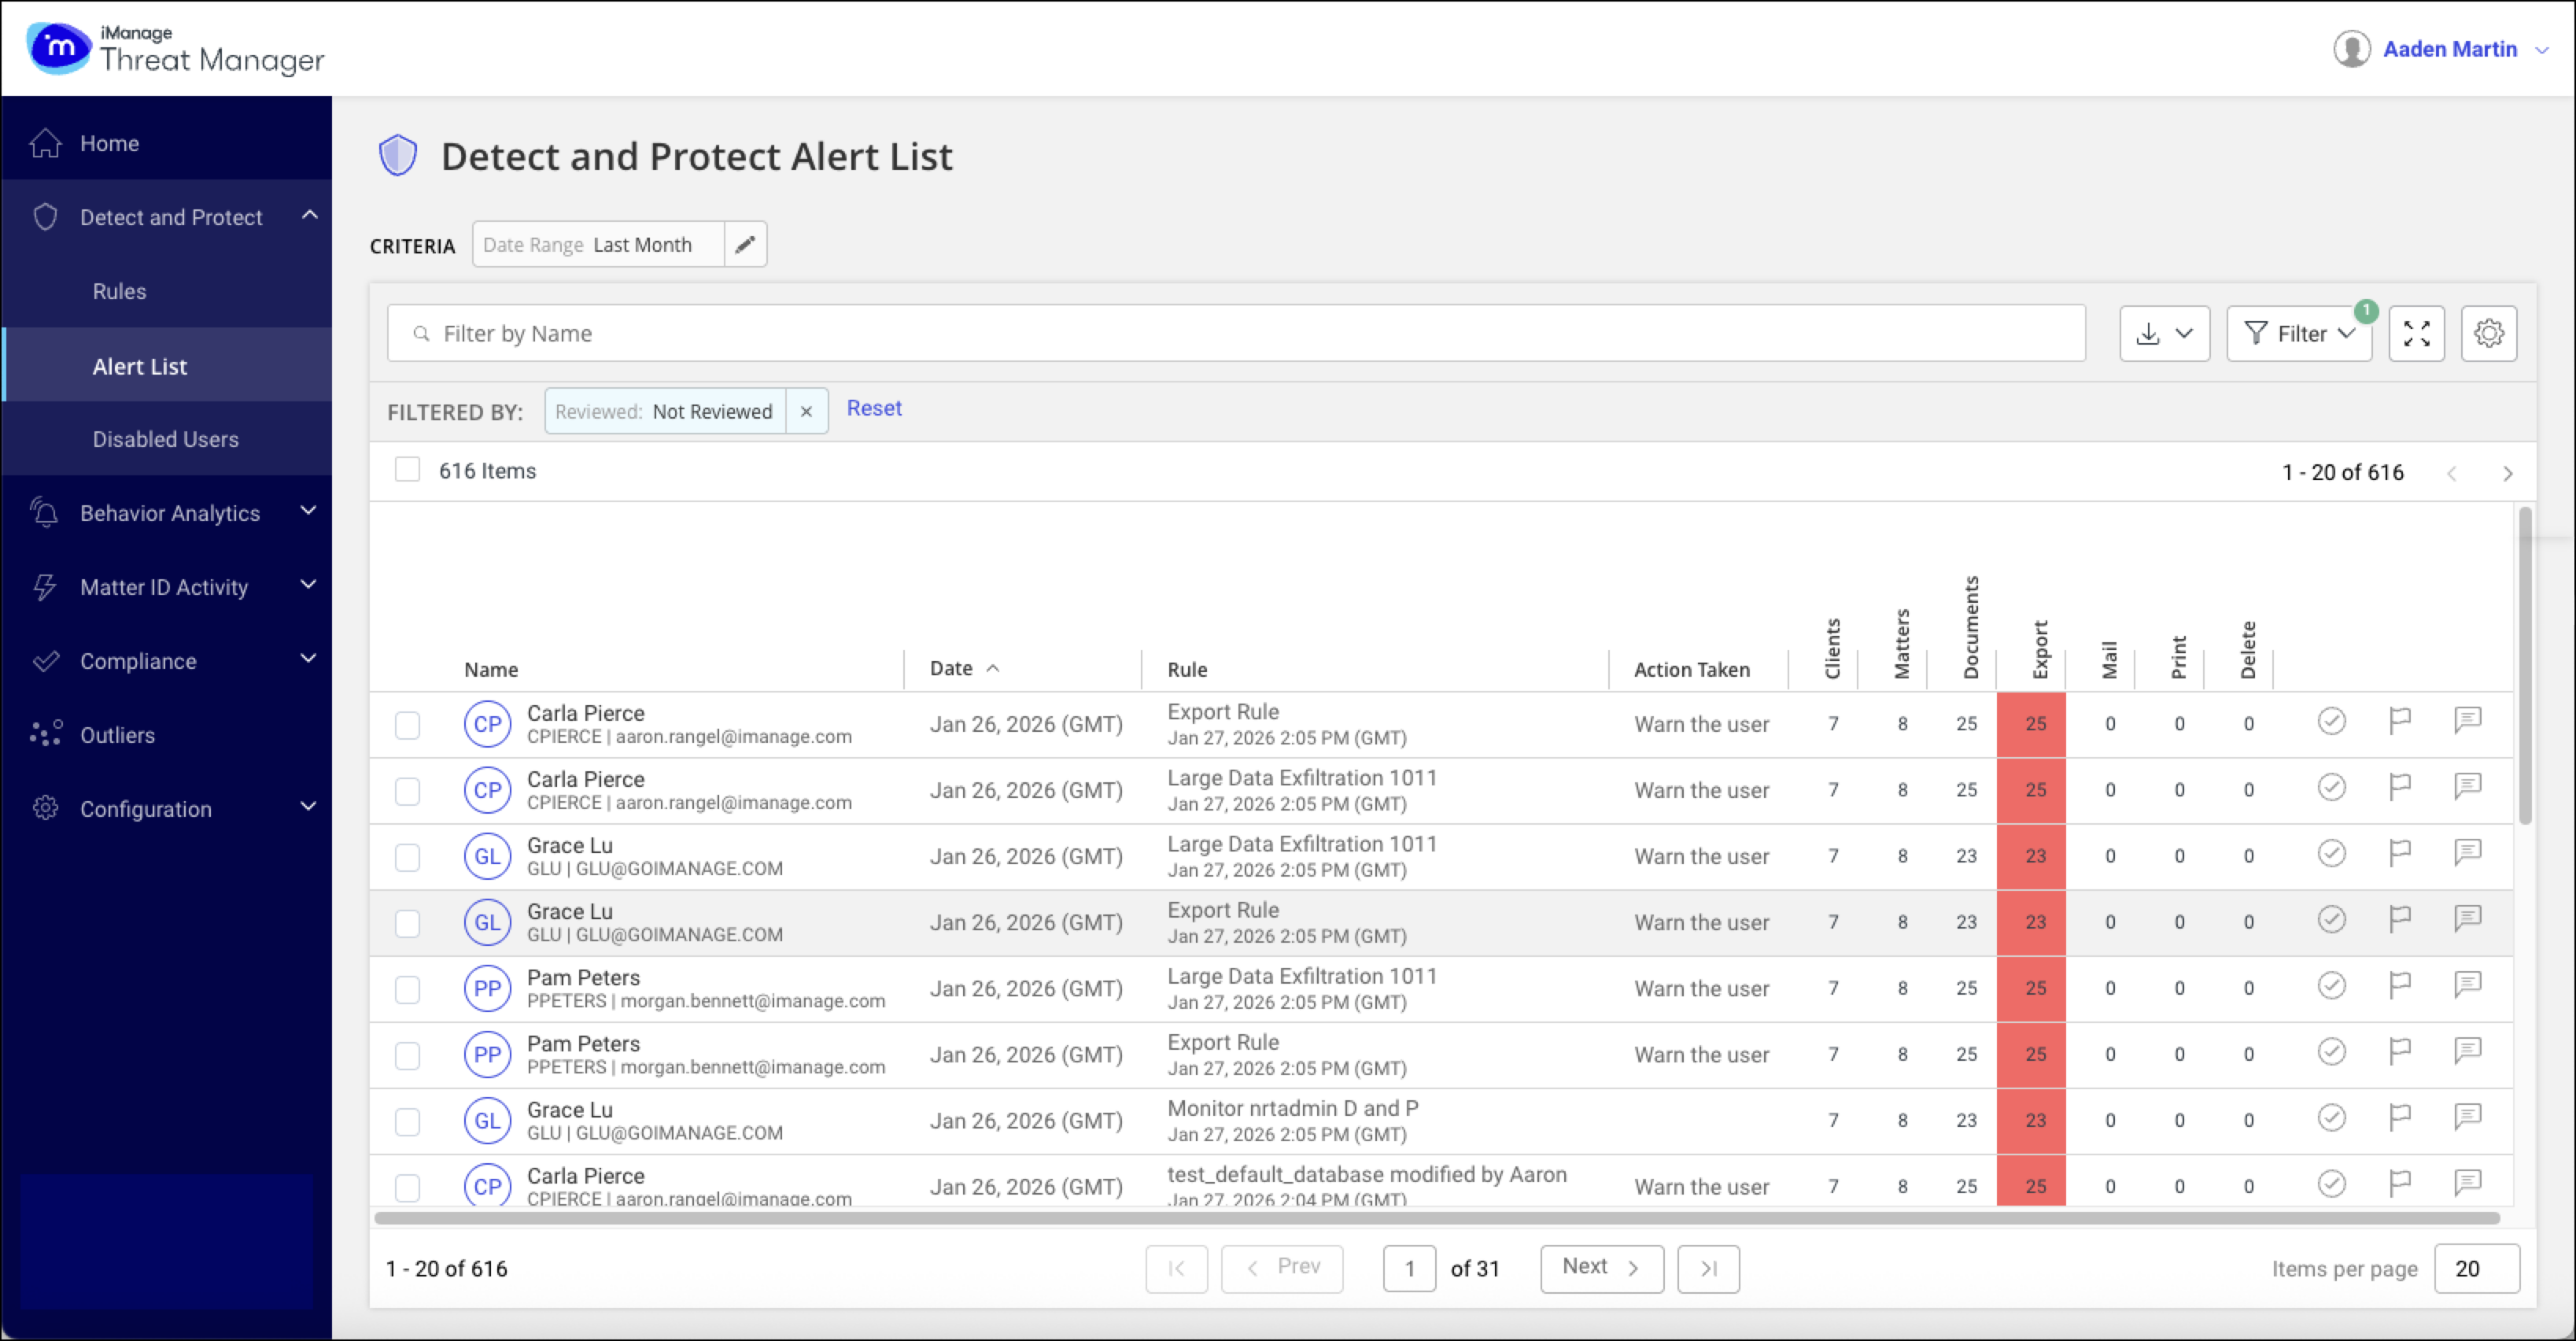
The Detect and Protect Alert List dashboard displays a list of alerts and activity details for each alert. Each alert includes the following information:
Name: The name of the user who triggered the alert.
Date: The date the alert was generated.
Rule: The name of the rule, along with the date and time the rule last ran. Hover over a column to see the details of the failure.

Action Taken: The action linked to the rule, such as disabling an account or warning a user.
Each alert also shows the number of related Clients, Matters, Documents, Exports, Mail, Prints, and Deletes.
When scrolling, the headers remain visible, and a vertical scroll bar appears inside the table. A full-screen button is available to expand the table for easier review.
Review, flag, and comment on the Detect and Protect Alert List
Each alert includes icons that show its review status and provide options to flag the alert or add comments.
Icon | Review Status |
|---|---|
 | To be Reviewed (default status): Select this icon to mark it as reviewed and remove it from the Alert List. |
 | Reviewed: Appears briefly after you mark an alert as reviewed, before it’s removed from the list. |
 | Not Flagged: Select this icon to flag an alert, to review later or mark it as higher priority. |
 | Flagged: Select this icon to remove the flag from the alert. |
 | Add Comment: Select this icon to open the Add Comment dialog and enter alert-specific details, such as investigation steps, findings, or conclusions. You can add multiple comments. The Comment field supports up to 2,000 characters, including hyperlinks. Comments are clickable and open in a pop-up window for full-text viewing. |
 | Comments Present: Indicates that one or more comments have been added to the alert. |
Sort and filter alerts in the Detect and Protect Alert List
You can sort the Detect and Protect Alert List by any of the named columns. Select the column name to sort the list by its values.
NOTE: If you have the Role Manager role, the user names under Name are hyperlinked. Selecting the link navigates you to the corresponding user page under Configuration > Roles, where you can view additional details about that user.
To narrow the alerts displayed, enter a user name in the Filter by Name box, or use the Filter drop-down menu to refine the list further. If needed, you can download the alert list with the selected filters applied. For more information, refer to Download the Detect and Protect Alert List.
NOTE: You can Pin or Unpin the filter list as needed.
The following filters are available.
Filter | Description |
|---|---|
Reviewed | Options: All, Not Reviewed, Reviewed. By default, reviewed alerts aren't shown. Reviewed alerts remain visible until the page is refreshed. Select Reviewed for continued display. |
Rule | Options: All, Find Rule By default, alerts from all rules are displayed. To view alerts for a specific rule, enter the rule name in the Find Rule box. You can also add rules to the Rule filter for quick access. Select the configuration icon to open the Rule dialog, enter a rule name, and select Add Rule. To make the rule the default selection, turn on the Pre-selected option, then select OK. The rule appears in the filter list. To remove a rule, open the Rule dialog, select the three dots next to the rule, and choose Remove, or select the X next to the rule in the filter panel. |
Flagged | Options: All, Flagged, Not Flagged. By default, all alerts are displayed. |
Comments | Options: All, With Comments, Without Comments. By default, alerts are shown whether or not they include comments. |
Action Taken | Options: All, No Action, Warn the User, Disable account. By default, alerts with all action types are shown. |
Task: Download the Detect and Protect Alert List
You can download the Detect and Protect Alert List as a Microsoft Excel (XLSX, single spreadsheet), CSV, or PDF file:
NOTE: In Detect and Protect, there are two types of Excel downloads:
Excel (single spreadsheet): A flat, one-sheet export of the current view.
Excel (summary workbook): A multi-sheet workbook with PivotTables, available only from the Alert Details > Documents tab.
Select the
 Download button near the upper-right corner of the Alert List.
Select a format:
Download as CSV
Download as EXCEL (single spreadsheet)
Exports the current view, including applied filters and visible columns.Download as PDF
If you selected PDF filters are applied, choose:
Report with current filters applied to download only the filtered results.
Full report to download the complete alert list.
Select OK. The download begins.
View Detect and Protect alert details
Select an alert from the Detect and Protect > Alert List to open its Alert Details page. This page provides the alert summary, rule information, user identity details, document activity, activity trends, and rule configuration.
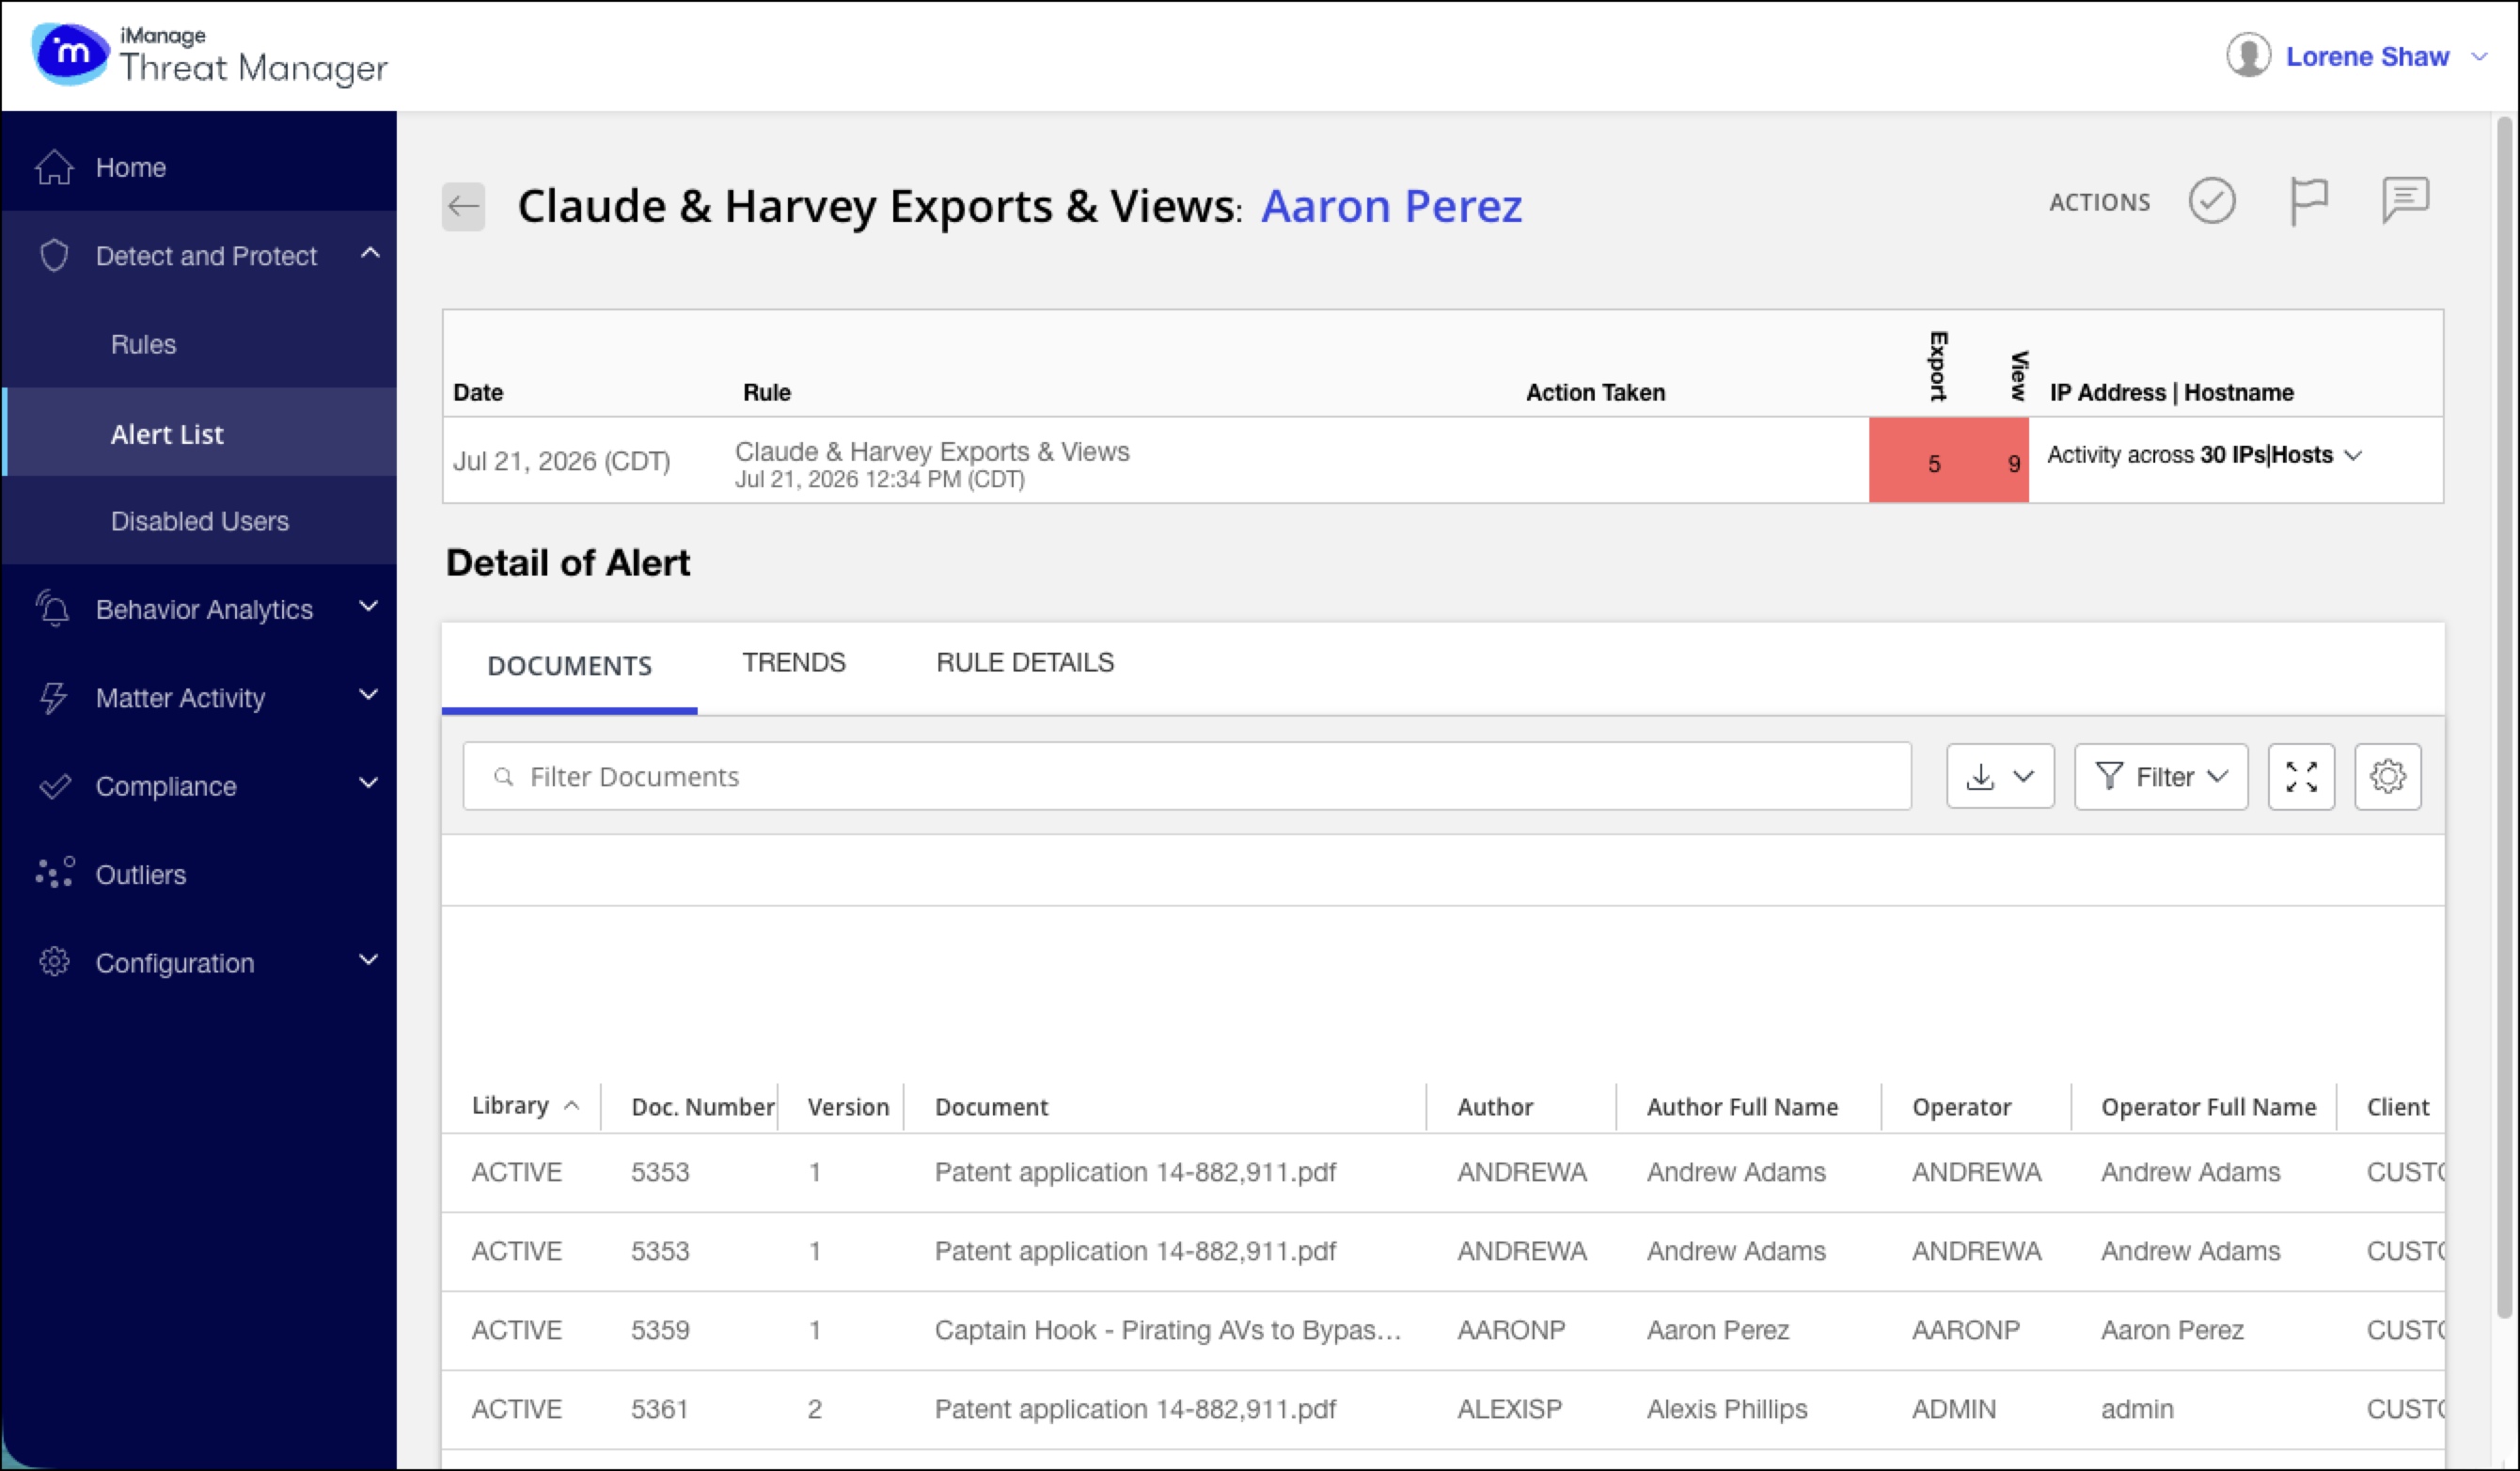
Rule and user information
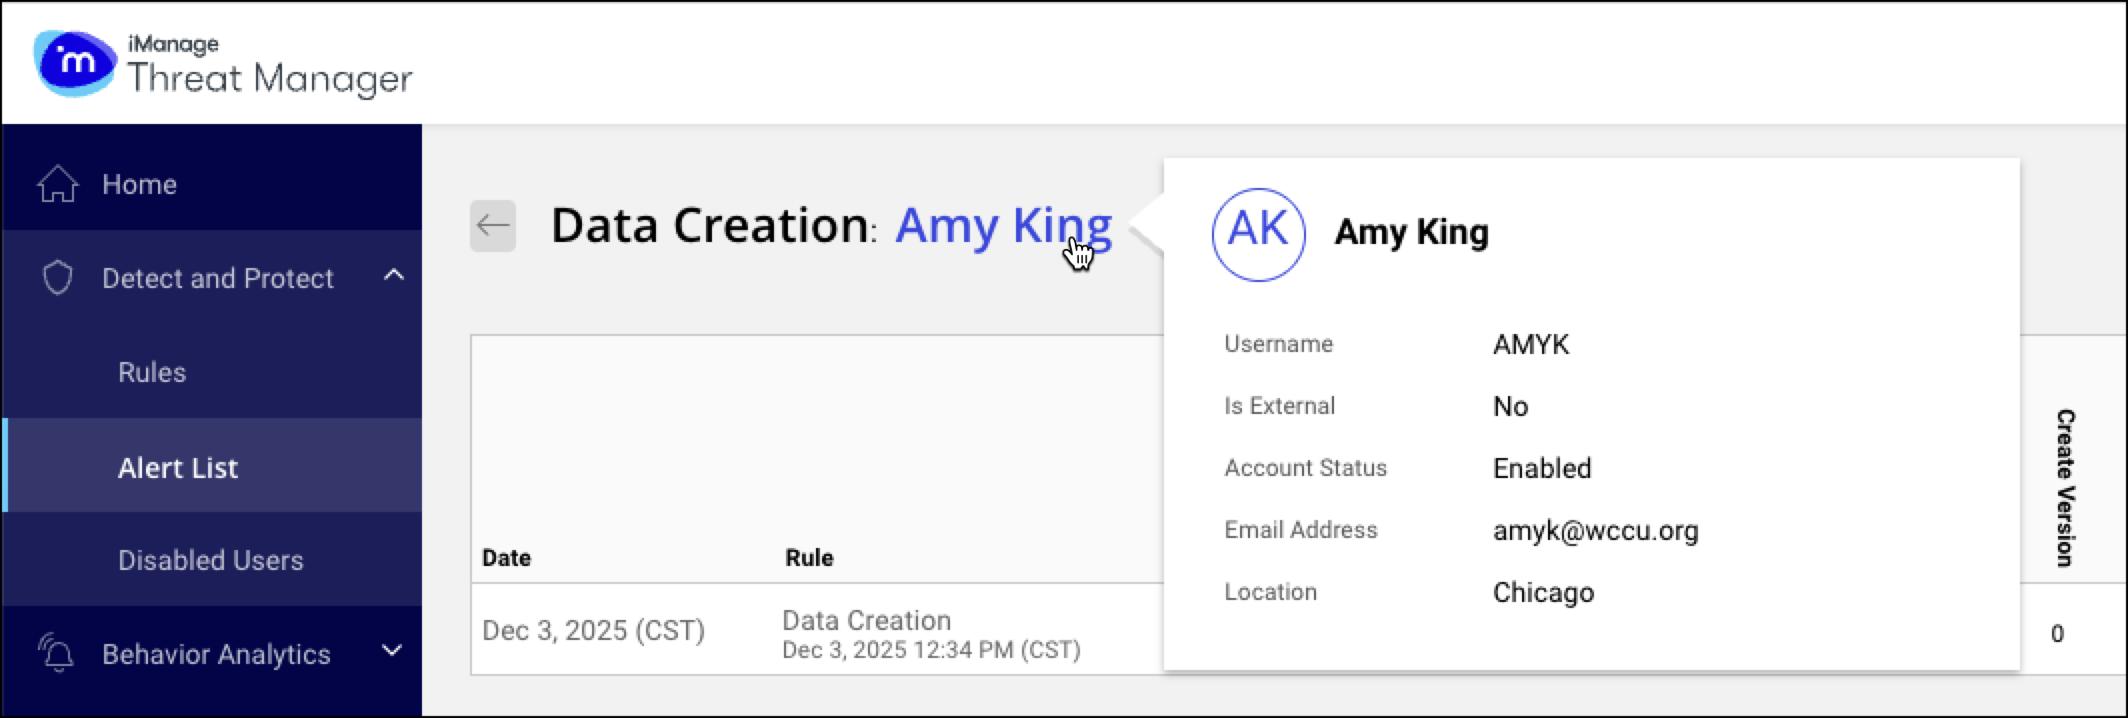
The top left of the Alert Details page displays the rule name that triggered the alert and the user name. Hovering over the user name shows:
Full Name
Username
Is External
Account Status
Email Address
Location
Additional metadata (Manager, Department, and so on) is displayed if configured. These details are read-only and are obtained from iManage Work.
NOTE: For more information about configuring these extended properties, refer to Using the User Metadata Importer in iManage Threat Manager Administration Help.
Alert summary
The alert summary shows the same information as the main Alert List, plus:
IP address | Hostname: Source of activity.
Number of unique locations.
A filtering option for activity by IP or hostname.
For more information, refer to Sort and filter alerts in the Detect and Protect Alert List.
NOTE: IP addresses are supported in iManage Work 10.x web and desktop clients. Older clients display hostname instead.
Documents tab: View document activity
The Documents tab displays all documents and activity related to the alert. It includes:
Document details: Metadata such as custom1–16, 29, 30, class, and sub-classes.
User activity: Actions the user performed on each document during the alert period.
Access information: How and when documents were accessed.
Application: Which application performed each activity (for example, Ask iManage, Claude, or Harvey).
Only rule-matching activities by default (other activity columns can be added). For example, if the rule monitors View, Mail, Export from DMS, and Checkout, only those activities appear.
Columns that always appear and can’t be removed
The following columns always appear in the Documents tab and can’t be removed.
Library
Doc. Number
Version
Document
Client
Custom1 Description
Matter
Custom2 Description
IP Address | Hostname
When scrolling, the headers remain visible, and a vertical scroll bar is displayed inside the table. A full-screen button is available to expand the table for easier review.
Filter document activities
Use the search box or Filter icon to refine the document list. Filters include:
Activity: The activities to show. By default, all document activities are selected.
IP Address | Hostname: Source locations. By default, all the IP addresses and hostnames from which a document was accessed are displayed.
Custom fields: Select which metadata fields to display. By default, all fields are displayed.
Applications: The application(s) involved in the alert’s activity. You can filter only by applications specified in the rule’s criteria. If the rule doesn’t specify any applications, you can filter by all available applications.
When a filter is applied, a Reset option is displayed next to the active filter chip(s). Select Reset to clear all applied filters and return to the full, unfiltered document list.
NOTE: You can Pin or Unpin the filter list.
Customize columns
Select the Settings icon to show or hide columns. Some columns, such as document numbers, are always visible and can’t be hidden. You can also resize columns or reset the layout. The Reset option restores default column visibility and column widths.
Task: Export document and activity data
From the Documents tab, you can export details as:
CSV: Exports a flat, comma-separated file of document and activity data.
Excel (summary workbook): Exports document and activity data as a multi-sheet Microsoft Excel (XLSX) summary workbook with built-in PivotTables and supporting metadata. For details, including available worksheets, PivotTables, and analysis guidance, refer to Exporting alert data to multi-sheet Microsoft Excel workbook.
PDF: Exports a formatted PDF version of the document list and activity data. If the dataset is large, this option may not be available; a tooltip provides additional details.
To export document and activity data:
In the Documents tab, select the Download icon.
Select a format: CSV, EXCEL, or PDF.
If filters are applied, select Report with current filters applied or Full report.
Select OK to download the file.
Trends tab: View activity trends
The Trends tab on the Alert Details page provides visual summaries of user activity over time. Available charts include:
Activities chart: Shows daily counts of user activities. Use the chart controls to select which activities to display.
Clients, Matters, and Documents histograms: Show the number of items accessed during the selected time period. You can drill down into each histogram to view more detailed information:
Clients: View client names and their activity counts.
Matters: View matter names, related clients, and activity counts.
Documents: View document names, related clients and matters, and activity counts.
At the deepest level, each histogram shows the specific clients, matters, or documents accessed during the selected time period.
NOTE: The Activities chart includes a Day of alert label for easy reference.
Change chart date ranges
You can expand or reduce the date range shown in the Trends tab to view activity before or after an alert. In the upper-right corner of the activity charts, enter a number or use the arrows in the Days before alert or the Days after alert fields. The charts update immediately when the range changes.
Days before alert: Can be extended up to 90 days before the alert
Days after alert: Can be extended from the alert date up to the present day.
NOTE: The Days after alert range can't extend beyond the current date.
Task: Export activity charts
You can export user activity data from the Clients, Matters, or Documents charts to Microsoft Excel (single spreadsheet), CSV, or PDF. The exported file includes:
Documents, matters, or clients accessed by the user within the selected time range.
Activities performed on those items.
Related details such as document types, Client IDs, and Matter IDs.
To export activity chart data:
Below the Clients, Matters, or Documents chart, select Download.
Select a format—CSV, EXCEL (single spreadsheet), or PDF. The file downloads to your default location.
NOTE: Download as PDF may not be available for large charts. Tooltips provide additional information.
Rule Details tab: View rule configuration
The Rule Details tab is available on the Alert Details page. It displays Detect and Protect Rule Summary and Criteria Summary, as defined in the Detect and Protect rule configuration, including Application criteria if configured.
Exporting alert data to a multi-sheet Microsoft Excel summary workbook
This export provides deep analysis functionality with multiple worksheets, metadata tables, and interactive PivotTables. It’s only available from Detect and Protect > Alert List > Alert Details > Documents tab.
NOTE: The Microsoft Excel export includes interactive PivotTables and the underlying data used to generate them. You can customize views directly in Excel by adding fields, changing groups, and applying filters. For guidance on working with Excel summary workbooks, PivotTables, field availability, refresh behavior, and performance considerations, refer to Working with Microsoft Excel PivotTables in Threat Manager exports.
Task: Generate a Microsoft Excel report
In Detect and Protect > Alert List, select the alert to view its Alert Details page.
In the Documents tab, apply any filters as needed.
Select Download as EXCEL.
Threat Manager generates a structured, multi-sheet Microsoft Excel summary workbook with analysis-ready PivotTables.
Customize data in Excel
The workbook includes both visible summary sheets and the underlying data used by the PivotTables.
You can add fields (for example, MatterID) to the PivotTable Field List.
If a field was included in the export, Excel populates it immediately.
If a field wasn't exported, it won't be available to add.
What’s in the Microsoft Excel summary workbook
The Microsoft Excel summary workbook generated from Detect and Protect > Alert List > Documents contains the following worksheets:
Help: Lists and describes the worksheets included in the report.
Alert Details: Summarizes the alert, including date and time, triggering rule, action taken, activity counts (for example, Create, View, Export), and IP address/hostname details. This sheet also includes rule configuration details such as criteria, included and excluded users, notifications, time zone, and defined actions.
User Summary Details: Shows user identity data (ID, name, title, department, manager, practice area, location, phone) and summary metrics, including unique clients, matters, and documents accessed, and documents owned versus not owned. User data is populated through the User Metadata Importer.
Client & Matter ID (PivotTable): An interactive PivotTable to analyze activity by client, matter, user, and document.
Data source: Total User Activity sheet.
NOTE: The Client and Matter ID fields are sourced from Control Center metadata, specifically the custom1 and custom2 properties. Depending on your organization’s configuration, these fields may be labeled differently (for example Custom1/Custom2, Client/Matter, or other tenant-specific names). The PivotTable displays the values as configured in your environment.
Document Activity (PivotTable): Summary of document-level activity with totals and key metadata. Customize by adding/removing fields and filtering.
Data source: Document Metadata Details sheet.Document Metadata Details: Provides the full set of document metadata and user activity records used by the PivotTables. Includes library, document number and version, class, subclass, type, author and operator details, application name, comments, client and matter IDs and names, IP address or hostname, practice area, and custom fields (for example, custom13–15).
Total User Activity: A complete record of all document-related actions performed by the user(s) involved in the alert on the day the alert was raised. Includes document details, client and matter context, IP address or hostname, practice area, activity tracking, export and mail metrics, status indicators, custom fields, and a Total Activity Count column.
Activity Glossary: Definitions of the activity types present in the workbook. The glossary includes only the activity types contained in the export. This helps readers (especially those who don’t sign in to iManage Threat Manager) interpret activity types.
Download as EXCEL option: Available export formats
The Download as EXCEL option produces different types of files depending on where you are in the UI. Two types of Excel export are available:
Excel single spreadsheet
Excel summary workbook
Download as EXCEL (single spreadsheet)
A flat, one-sheet export of the current view. Doesn't include summaries or PivotTables. Use this option for quick, view-based exports.
Available at:
Detect and Protect > Alert List
Detect and Protect > Alert List > Alert Details > Trends tab charts
Download as EXCEL (summary workbook)
A multi-sheet workbook with PivotTables, metadata, and structured datasets. Used for in-depth analysis and sharing outside Threat Manager.
Available at:
Detect and Protect > Alert List > Alert Details > Documents tab