The Metrics summary section of the Overview tab displays tiles with metrics for all of a partner’s live reseller-contracted customers on cloudimanage.com. The metrics in each tile are calculated across the partner’s full live reseller-contracted customer portfolio for the billing period selected in the Statement Month drop-down list.
NOTES:
In this context, customer portfolio refers to your reseller-contracted customers who were live on cloudimanage.com during the selected billing period.
The Products section of the Overview tab is described on the Products section page.
This section includes the following topics:
Metrics summary section
The Metrics summary section includes the following tiles that provide details about your customer portfolio:
Customers: This metric shows the total number of active customer accounts.
Subscribed Users: This metric shows the total number of Work user licenses.
Active Users: This metric shows the total number of active billable users.
User Subscription Rate: This metric shows user license utilization. It’s expressed as a percentage and is calculated by dividing Active Users by Subscribed Users.
Total Storage: This metric shows the total amount of subscribed storage, in gigabytes (GB).
Storage Used: This metric shows the total amount of storage used, in gigabytes (GB).
Storage Utilization: This metric shows how much of the available storage is being used. It’s expressed as a percentage and is calculated by dividing Storage Used by Total Storage.
The following figure shows an example of the Metrics summary section of the Overview tab.
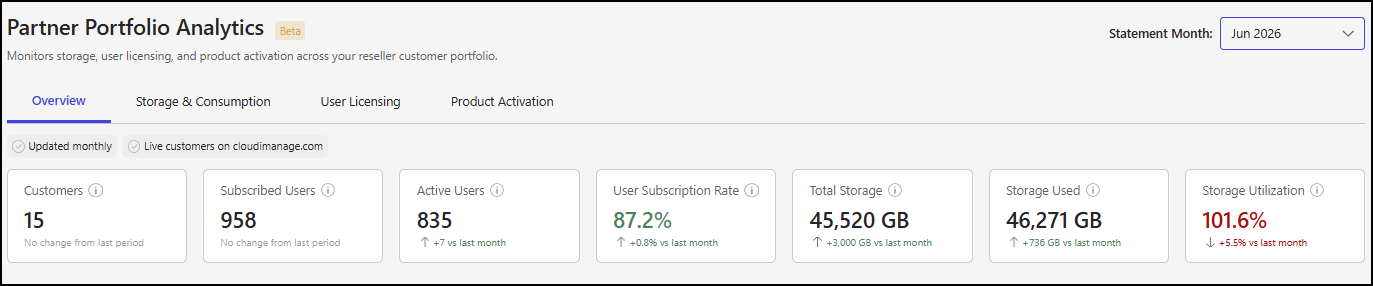
Metrics summary section details
Comparison message
Each tile includes a comparison message that indicates how the metric changed from the previous billing period:
No change from last period: The metric didn’t change from the billing period for the month before the selected month.
[+-]x vs last month: The metric increased or decreased in the billing period for the selected month compared to the previous billing period, where x is one of the following:
An integer for the Customers, Subscribed Users, Active Users, Total Storage, and Storage Used tiles.
A percentage for the User Subscription Rate and Storage Utilization tiles.
For the User Subscription Rate tile, the comparison message uses the following colors:
Red: The user subscription rate is less than or equal to 49%.
Amber: The user subscription rate is between 50% and 74%, inclusive.
Green: The user subscription rate is greater than or equal to 75%.
For the Storage Utilization tile, the comparison message uses the following colors:
Green: The storage utilization rate is less than or equal to 89%.
Amber: The storage utilization rate is between 90% and 99%, inclusive.
Red: The storage utilization rate is greater than or equal to 100%.