The Products section of the Overview tab displays tiles with metrics for the subscription and activation of iManage products for all of a Partner’s live reseller-contracted customers on cloudimanage.com. The metrics in each tile are calculated across the Partner’s full live reseller-contracted customer portfolio for the date selected in the date picker field.
NOTES:
In this context, customer portfolio refers to your reseller-contracted customers who were live on cloudimanage.com on the selected date.
The Portfolio Snapshot section of the Overview tab is described on the Portfolio Snapshot section page.
This section includes the following topics:
Products section actions
In the Products section of the Overview tab, you can:
Select the date used to generate the data shown in the product tiles.
Choose an option from the products drop-down list to sort the product tiles.
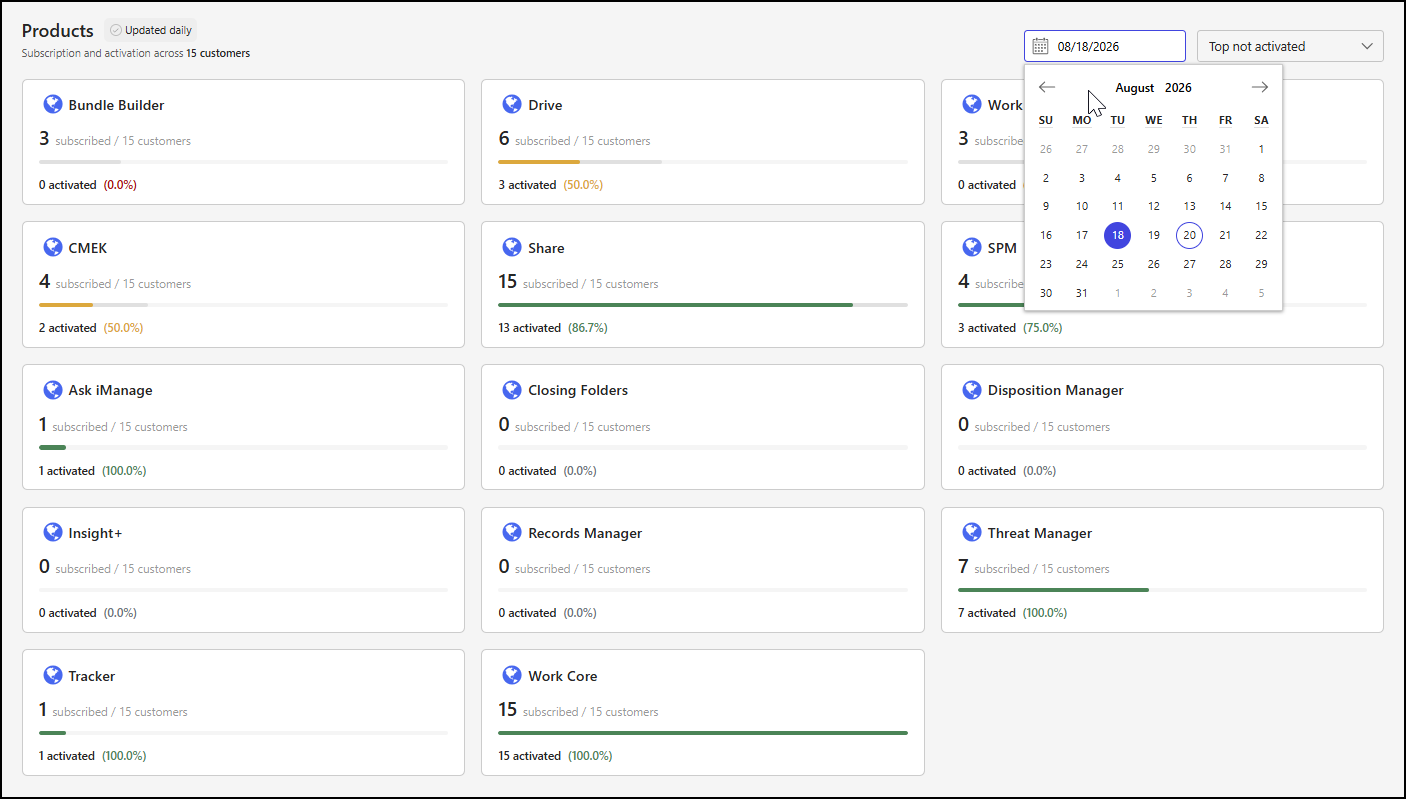
Select a report date
To choose a date used to generate the data displayed in the product tiles, select the date picker field and then choose a date.
Change product tile sorting
To change the way that product tiles are sorted, select the products drop-down list and then choose an option.
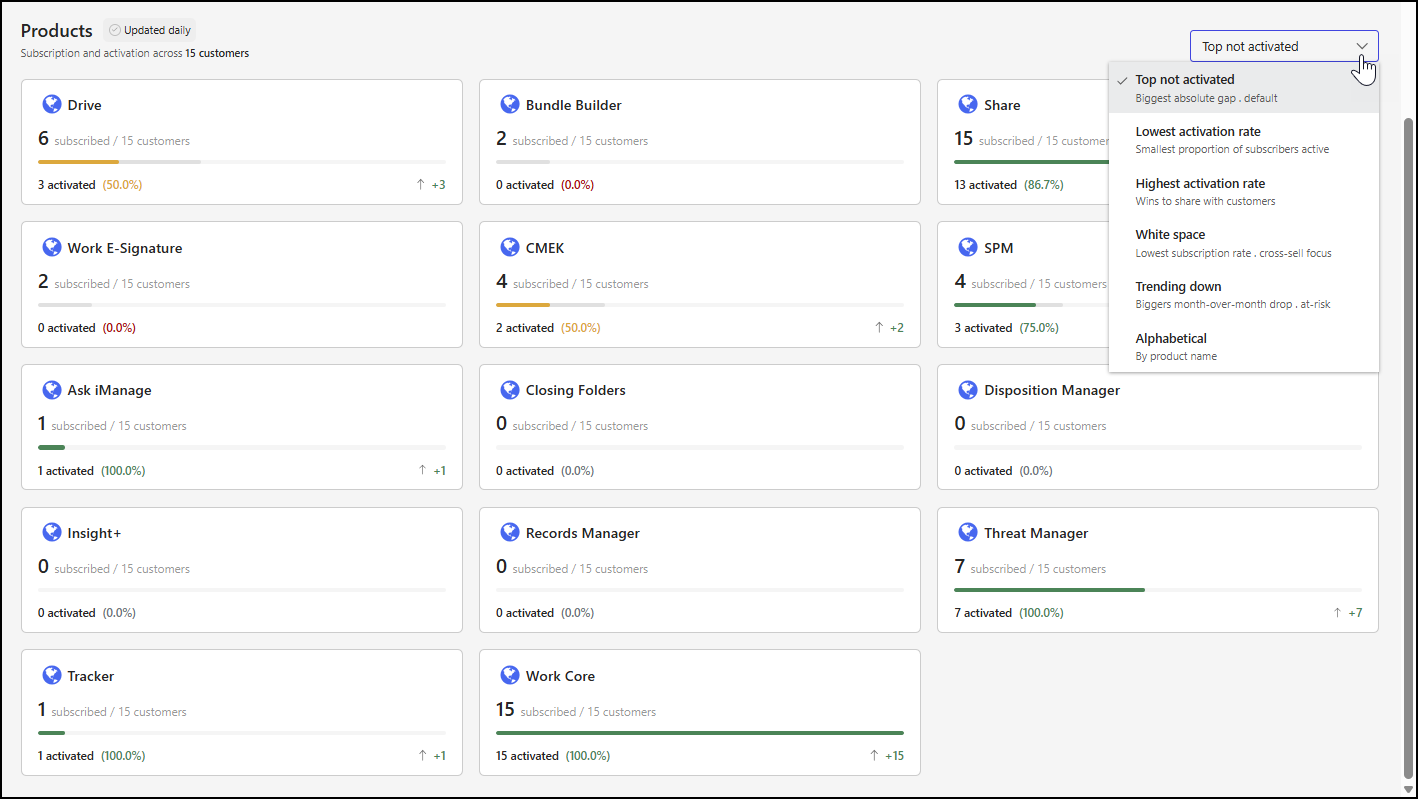
Available sort options include:
Top not activated: Displays products with no activated customers first. This is the default option.
Lowest activation rate: Displays products with the fewest activated customers first.
Highest activation rate: Displays products with the most activated customers first.
White space: Displays products with the lowest subscription rate first.
Trending down: Displays products with the largest decrease in activated customers first, comparing the billing period for the selected month with the previous billing period.
Alphabetical: Displays products alphabetically by product name.
Products section tiles
The Products section of the Overview tab features tiles that show subscription and activation metrics for iManage products. The following figure shows an example of this section, sorted alphabetically.
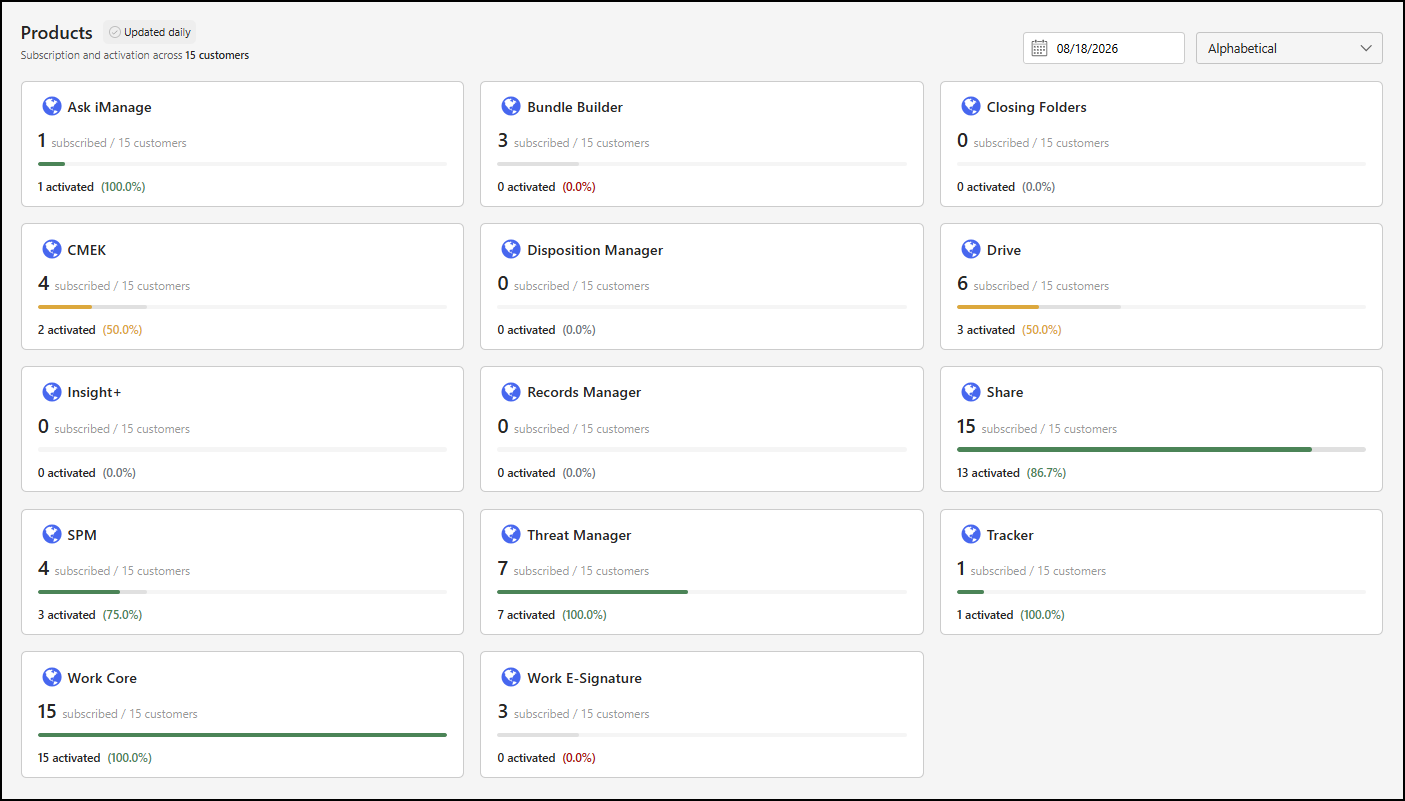
For each iManage product, the following table explains the criteria used to determine if a product has been activated.
NOTE: Product activation doesn’t indicate whether the customer is using the product.
Table: iManage product tiles
Product | Activation measure |
|---|---|
Ask iManage | The customer has enabled the Ask iManage App in Control Center. |
Bundle Builder | The customer has enabled the Bundle Builder App in Control Center. |
Closing Folders | The customer has enabled the Closing Folders App in Control Center. |
CMEK | The customer has one or more CMEK keys configured in Control Center. |
Disposition Manager | The customer has enabled the IDM App in Control Center. |
Drive | The customer has one or more users with Drive installed and has authenticated to cloudimanage.com in the last 30 days. |
Insight+ | The customer has enabled the Insight+ App in Control Center. |
Records Manager | The customer has enabled the IRM App in Control Center. |
Share | The customer has enabled the iManage Share App in Control Center. |
SPM | The customer has one or more SPM policies applied to a Work library. |
Threat Manager | The customer has enabled the Threat Manager App in Control Center. |
Tracker | The customer has enabled the Tracker App in Control Center. |
Work Core | The customer is live on cloudimanage.com. |
Work E-Signature | The customer has enabled the E-Signature App in Control Center. |
Products section tile details
Tiles in the Products section include activation and subscription information about each product for your reseller-contracted customers who are live on cloudimanage.com. An example of the Drive product tile is shown in the figure below.
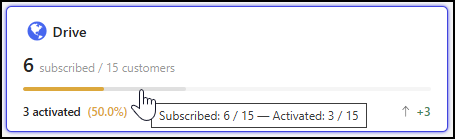
Product name: Shows the name of the iManage product.
x subscribed / y customers: This indicates the number of customers subscribed to the product (x) and the total number of customers in your portfolio (y).
Bar chart: This shows a segmented bar that displays the following details as applicable:
Activated: The number of your reseller-contracted customers who are live on cloudimanage.com who’ve activated the product. This segment displays only if you have customers who’ve activated the product.
Subscribed: The number of your reseller-contracted customers who are live on cloudimanage.com who’ve subscribed to the product. This segment displays only if you have customers who’ve subscribed to the product.
Total: The total number of your reseller-contracted customers who are live on cloudimanage.com.
NOTE: You can hover over the bar chart to show a summary of the number of your customers who’ve subscribed to and activated the product.
x activated (y%): This indicates the number (x) and percentage (y) of customers in your portfolio who’ve activated the product.
View a more detailed report
To open a page that displays more details about an iManage product, select the product tile. For more information, refer to Product detail page.