Storage page details
The Storage page provides the following reports related to storage:
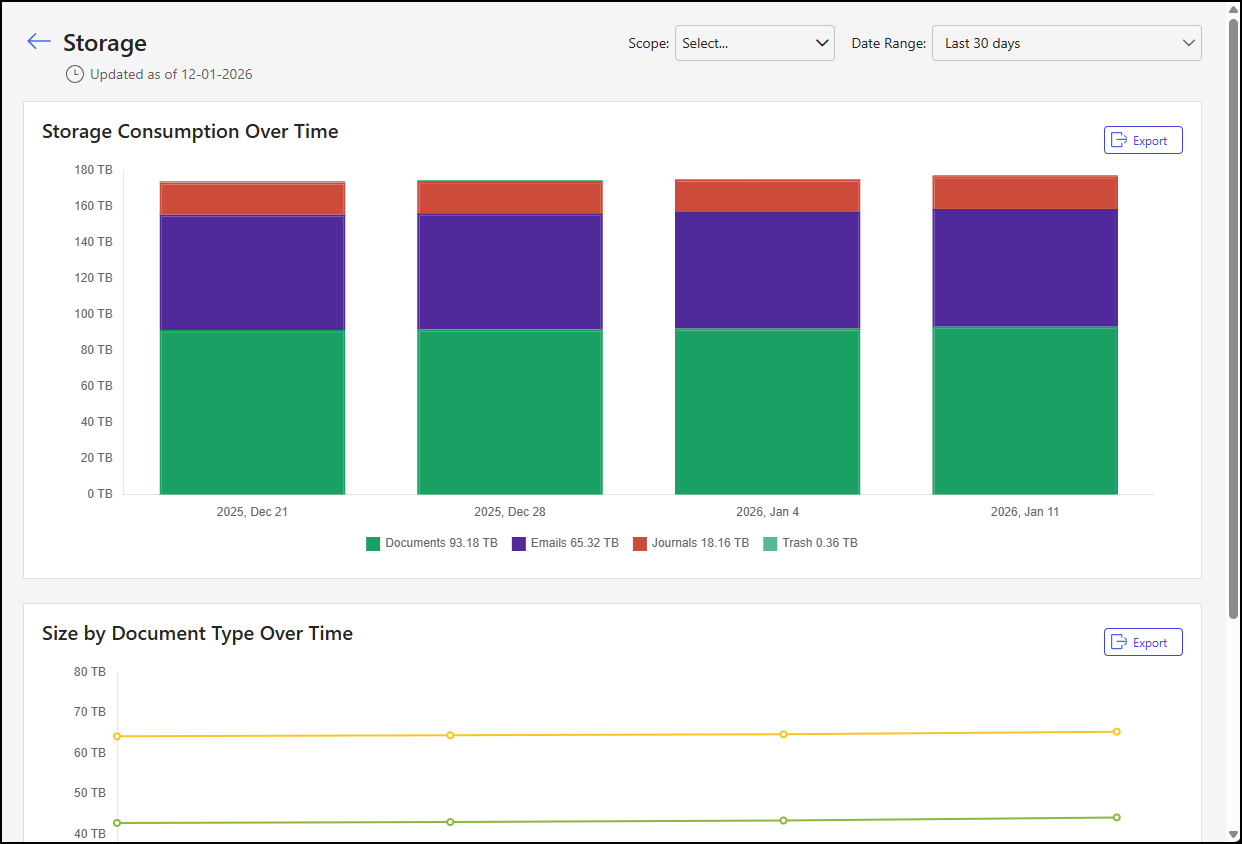
An example of the Storage page is shown in the figure below.
NOTES:
This page shows the date when the data was last updated.
By default, the charts on the Storage page display data collected from all of your iManage Work libraries over the past 30 days.
Report data is available starting from August 3, 2025.
Each reporting interval reflects the amount of storage used based on a point-in-time snapshot taken within that interval. On the Storage page, these snapshots occur weekly.
The values shown in the chart legends represent the storage usage for the most recent reporting interval.
To change the scope and reporting period, refer to Storage page actions.
INFO: Storage consumption is calculated using binary (base-2) units following the International Electrotechnical Commission (IEC) standard.
Storage page actions
On the Storage page, you can:
Change which iManage Work libraries contribute to the reports
Adjust the data reporting period
For more information on these actions, refer to the sections below.
Change which iManage Work libraries are included
By default, the Storage page reports display charts using data from all of your iManage Work libraries. To change the scope of the data shown, use the Scope drop-down list to select one, multiple, or all libraries.
Adjust the data reporting period
By default, the Storage page reports display data from your iManage Work libraries from the last month. To change the data reporting period, select from the following options in the Date Range drop-down list:
Last 7 days
Last 30 days (default)
Last 6 months
Custom
NOTE: When you select Custom, the From and To date picker fields will display. Use these fields to choose your desired date range.
Storage Consumption Over Time report details
The Storage Consumption Over Time tile provides the following details about your iManage Work storage usage during the specified data reporting period:
A stacked bar chart with each bar displaying segments for the following categories:
Documents
Emails
Journals
Trash
A legend showing the amount of storage used for each category in the last reporting interval
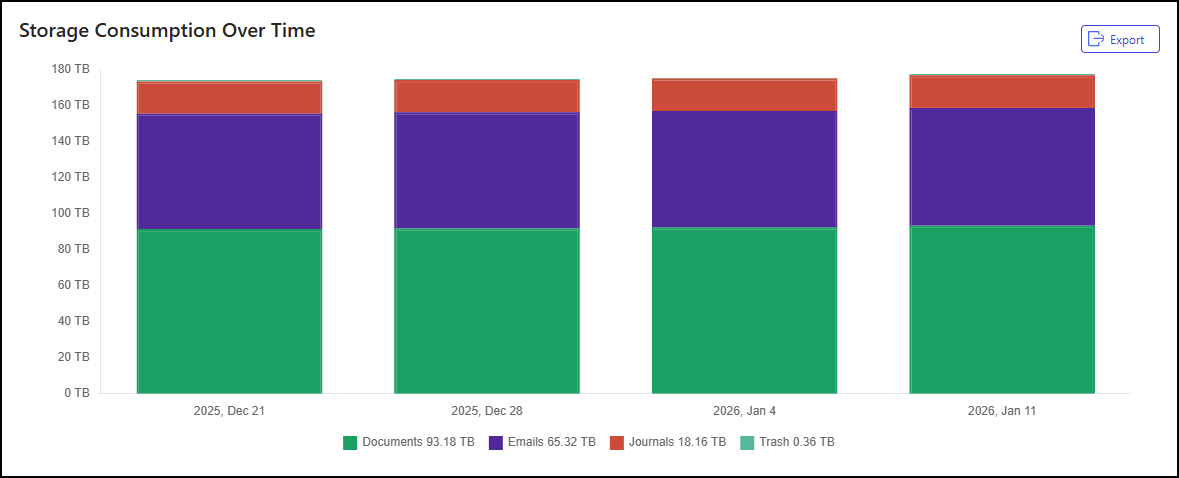
An example of the Storage Consumption Over Time tile is shown in the figure below.
Storage Consumption Over Time tile actions
In the Storage Consumption Over Time tile, you can:
Filter the storage consumption categories shown in the chart
Hover over a bar to see more details about the corresponding storage consumption data reporting period
Download storage consumption details in CSV format
For more information on these actions, refer to the sections below.
Filter storage consumption categories
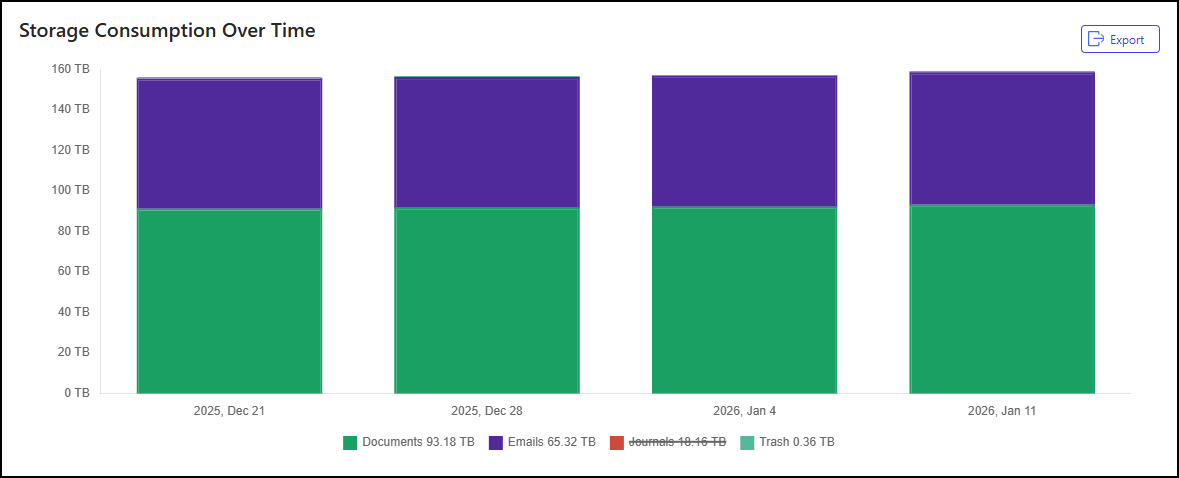
To filter the storage consumption categories shown in the chart, select one or more categories from the legend in the Storage Consumption Over Time tile. For instance, in the example below, the Journals category has been removed from each bar.
See more details about a data reporting period
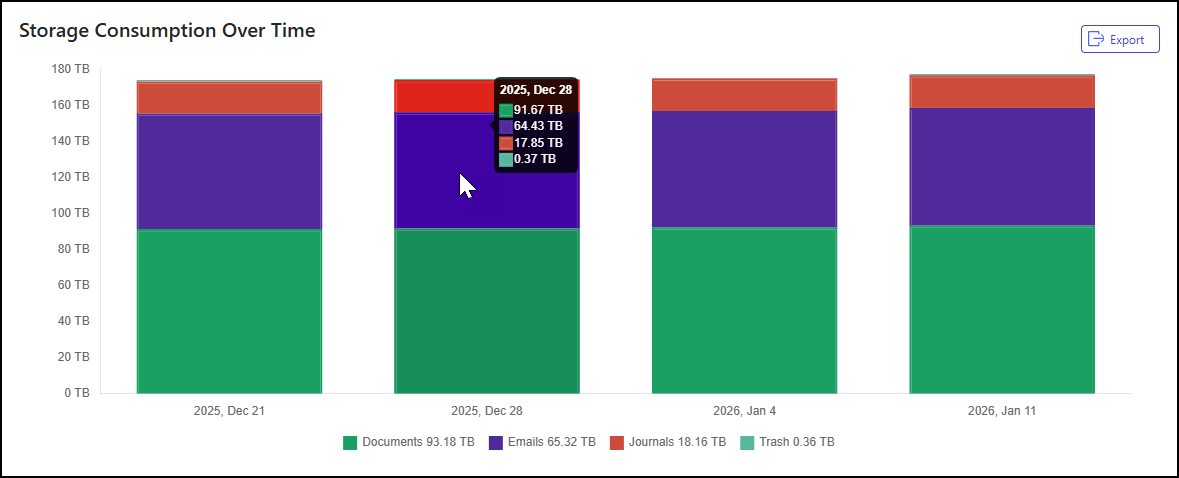
To see more details about a specific data reporting period, hover over a bar in the Storage Consumption Over Time tile. For instance, in the example below, a pop-up dialog shows the amount of storage used by each category for the 2026, Jan 11 data reporting period.
Download storage consumption details
To download storage consumption details in CSV format, select the Export button in the Storage Consumption Over Time tile.
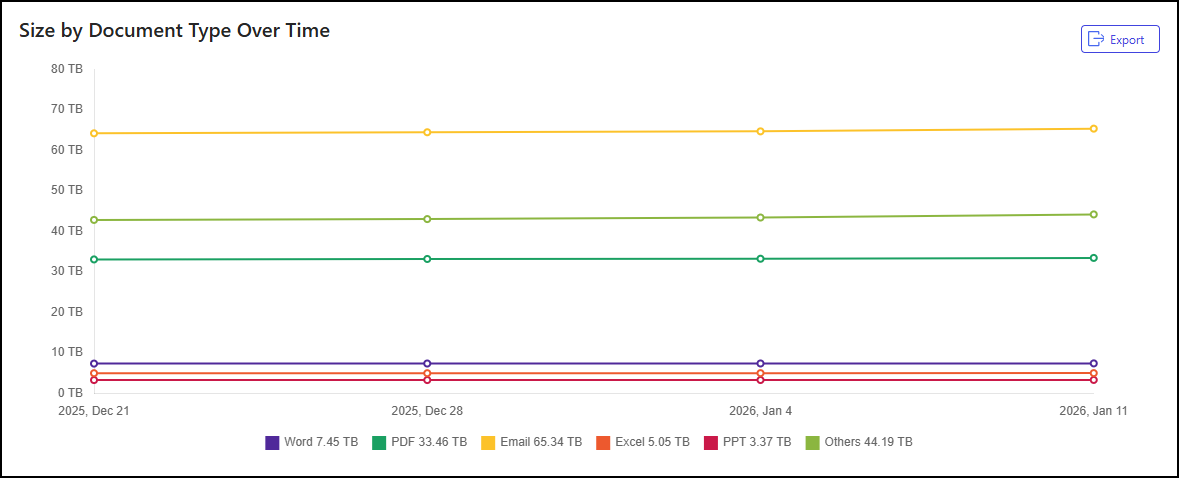
Size by Document Type Over Time report details
The Size by Document Type Over Time tile provides the following details about document types during the specified data collection period:
A line chart with a line showing storage usage for the following document type categories (each category lists the file extensions it includes):
Archive (.7z, .gz, .rar, .tar, .zip, .pst, .ost)
Audio (.aiff, .au, .flac, .m4a, .mp3, .oga, .wav, .wma)
Email (.mime, .notes, .gw, .eml, .msg)
Excel (.csv, .xla, .xlm, .xls, .xlsb, .xlsm, .xlsx, .xlt, .xltm, .xltx, .numbers, .qpw)
Image (.ai, .bmp, .gif, .jpeg, .jpg, .png, .psd, .tif, .tiff)
PDF (.pdf)
PPT (.pot, .potm, .potx, .ppam, .pps, .ppsm, .ppsx, .ppt, .pptm, .pptx, .shw)
Video (.3g2, .3pg, .asf, .avi, .flv, .m2v, .mkv, .mov, .mp2, .m4p, .m4v, .mp4, .mpeg, .mpg, .ogv, .qt, .rm, .webm, .wmv)
Word (.doc, .docb, .docm, .docx, .dot, .dotm, .dotx, .word, .rtf, .wpd)
Others (all other extensions)
A legend showing the amount of storage used for each category in the last reporting interval
NOTE: The Others category includes any items that don’t fit into the predefined reporting categories. If a new category is added in the future, some items currently in Others will be moved to the new category, which will reduce the amount shown in the Others category in subsequent reports.
An example of the Size by Document Type Over Time tile is shown in the figure below.
Size by Document Type Over Time tile actions
In the Size by Document Type Over Time tile, you can:
Filter the document type categories shown in the chart
Hover over a point on a line to see more details about the corresponding storage usage data reporting period
Download document storage usage details in CSV format
For more information on these actions, refer to the sections below.
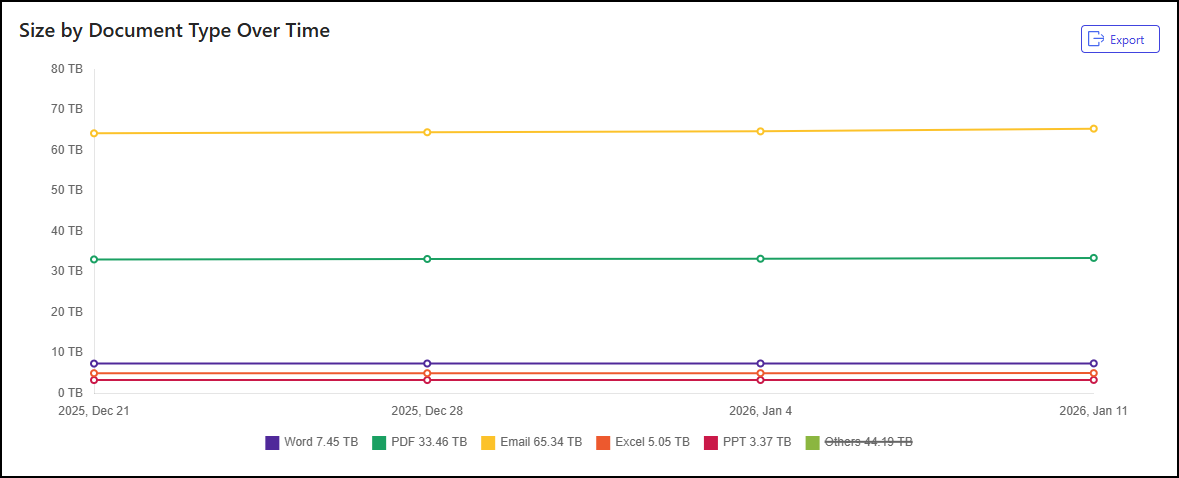
Filter document type categories
To filter the document type categories shown in the chart, select one or more categories from the legend in the Size by Document Type Over Time tile. For instance, in the example below, the PDF category has been removed from the chart.
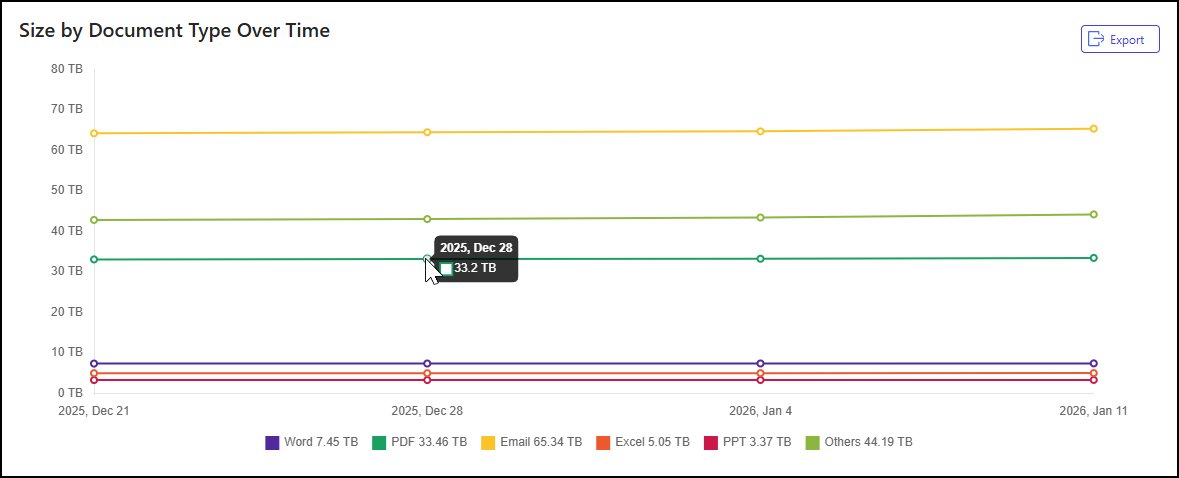
See more details about a data reporting period
To see more details about a specific data reporting period, hover over a point on a line in the Size by Document Type Over Time tile. For instance, in the example below, a pop-up dialog shows the amount of storage used by PDF category for the 2026, Jan 11 data reporting period.
Download document type details
To download document storage usage details in CSV format, select the Export button in the Size by Document Type Over Time tile.