The Usage Over Time report page provides a historical view of application usage activity across a selected reporting period. It lets users analyze and track application requests, application downloads, or both over time, helping identify usage trends and patterns across their iManage Cloud customer environments. Users can refine the report by customer, application, metric type, and date range to focus on specific usage scenarios and reporting needs.
The report includes an interactive line chart that displays request, download, and total API activity over the selected period, along with a color-coded legend for filtering the data displayed. Users can hover over chart data points to view detailed metrics for a specific reporting period and export report results to CSV format for further analysis.
On this page, you can use the available scope and date range filters to refine the data displayed in the report:
Customer: View usage data for all customers or select one or more specific customers.
Application: View usage data for all applications or select one or more specific applications.
Metric type: View application requests only, application downloads only, or both.
Reporting period: Adjust the date range to control the time period covered by the report.
NOTE: This page can be accessed by selecting the  icon in any of the following tiles on the Usage Analytics page:
If you access the page from a requests tile, application requests are displayed by default. If you access it from a downloads tile, application downloads are displayed by default.
An example of the Usage Over Time page is shown in the figure below.
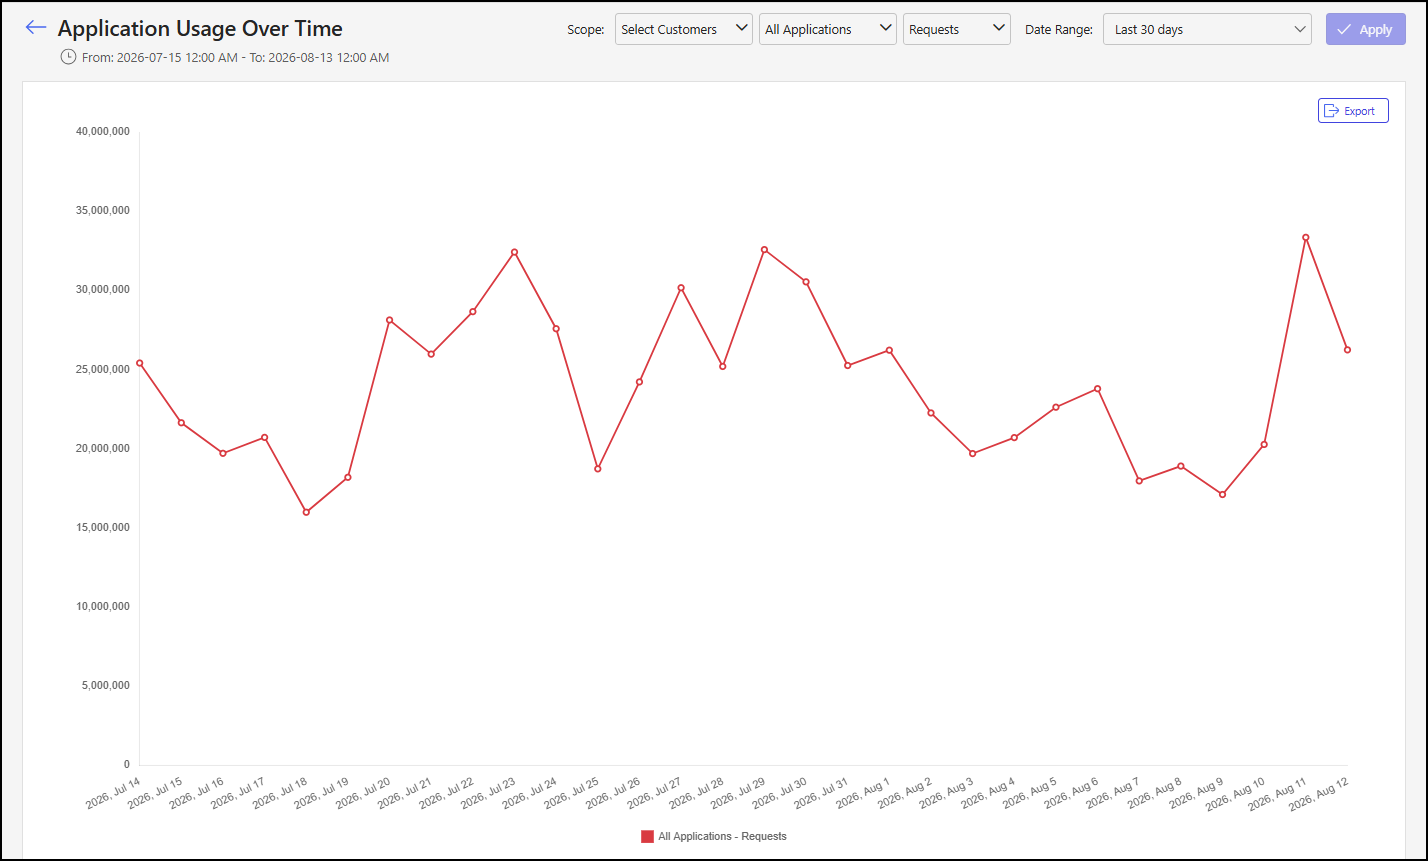
Usage Over Time page actions
On the Usage Over Time page, you can:
View data for all customers, or search for and select one or more specific customers
View data for all applications, or search for and select one or more specific applications
Specify if the chart should show data for application requests only, application downloads only, or both
Adjust the data reporting period
Download application request and download details in CSV format
For more information on these actions, refer to the sections below.
Select which customers are included
By default, the report shows application usage data for all customers in your portfolio. To change which customer usage data is displayed, use the Customer drop-down list to search for and select one, multiple, or all customers, and then select Apply.

Select which applications are included
By default, the report shows application usage data for all applications used by customers in your portfolio. To change which application usage data is displayed, use the Application drop-down list to search for and select one, multiple, or all applications, and then select Apply.

Select which metric types are included
The default metric type shown in the report depends on how you accessed the report page.
NOTE: This page can be accessed by selecting the icon in any of the following tiles on the Usage Analytics page:
If you access the page from a requests tile, application requests are displayed by default. If you access it from a downloads tile, application downloads are displayed by default.
To change which metric type’s usage data is displayed, use the Metric Type drop-down list to search for and select one or more of the following metric types, and then select Apply.
Requests
Downloads
Total APIs (all metric types)

Adjust the data reporting period
By default, the report shows application usage data for the last 30 days for customers in your portfolio. To change the reporting period, use the Date Range drop-down list to select one of the following options, and then select Apply.
Last 7 days
Last 30 days
Last one year
Statement Period
Custom

NOTES:
The Statement Period section includes an option for each month in which data is available.
When you select Custom, the From and To date picker fields will display. Use these fields to choose your desired date range.
Download application request and download details
To download application request and download details in CSV format, select the Export button.
NOTE: When you export data, any active scope or data reporting period selections are applied. As a result, the downloaded file includes only the details applied at the time you select Export.
Usage Over Time report details
The Usage Over Time report provides the following details about application usage over the specified reporting period:
A line chart with a line for each of the following metric types:
The number of application requests
The number of application downloads
The combined number of application requests and downloads
A color-coded legend showing which types are included in the chart
NOTE: In the Scope section, use the metric type drop-down list to select which types the line chart includes. You can select one, two, or all three types. The chart shows a line only for each selected type.
An example of the Usage Over Time page with all three metric types selected is shown in the figure below.
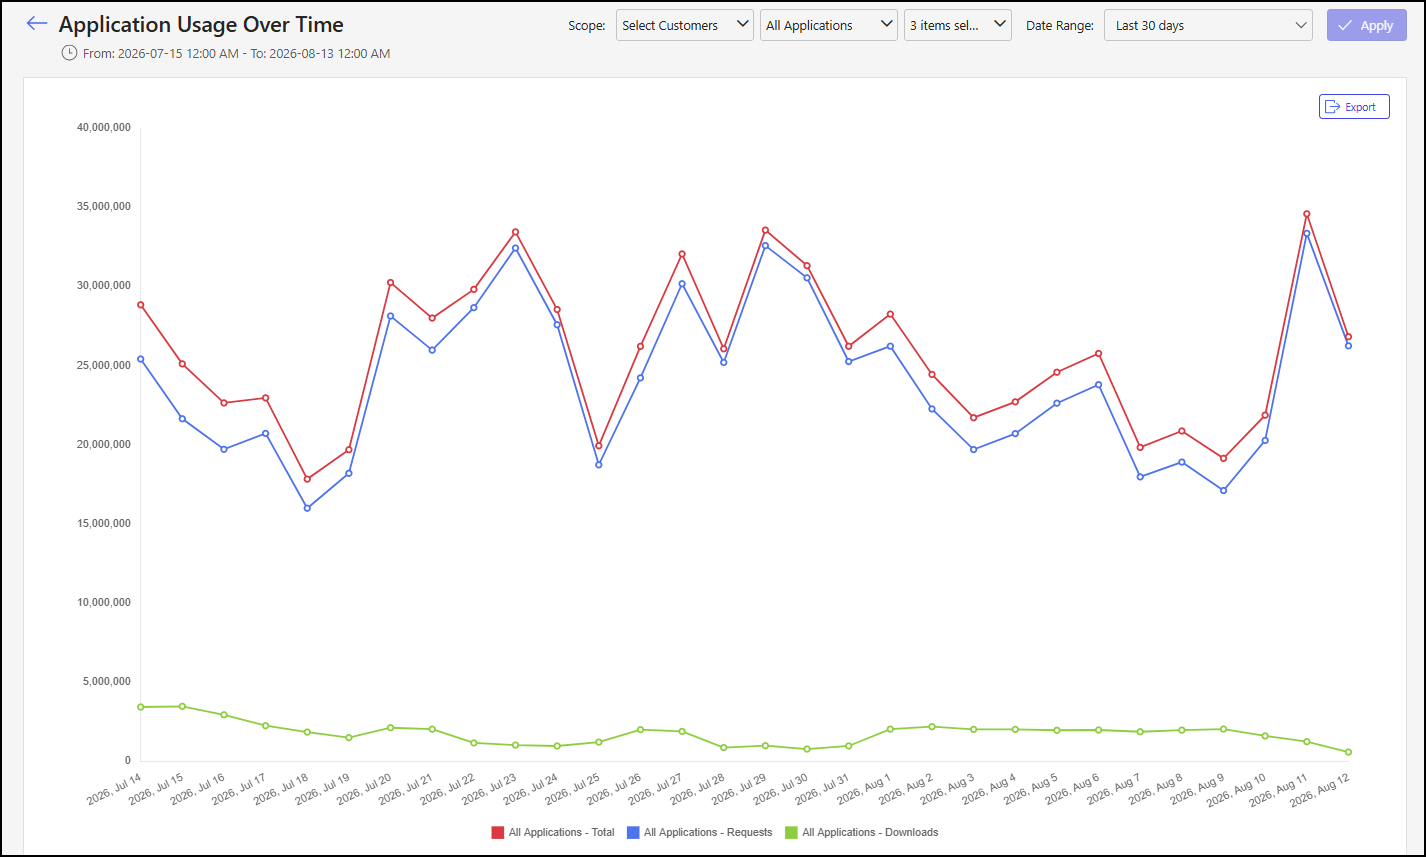
Usage Over Time report actions
In the Usage Over Time report, you can:
Filter the metric types shown in the chart
Hover over a point on a line to see more details about the corresponding data reporting period
Download application usage details in CSV format
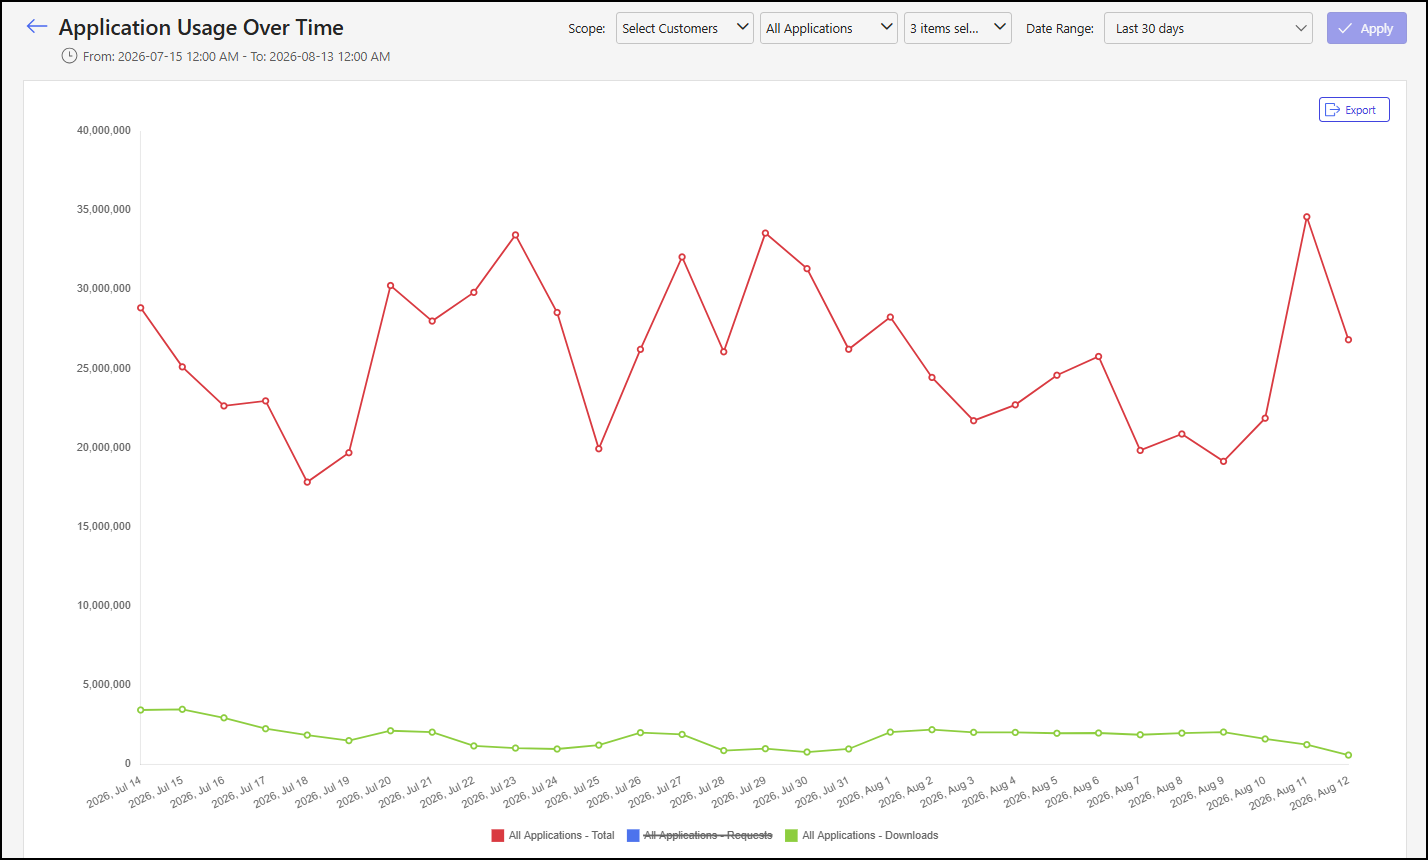
Filter metric types
To filter the metric types shown in the chart, select one or more types from the legend in the Usage Over Time report. For instance, in the example below, the Requests metric type has been removed from the chart.
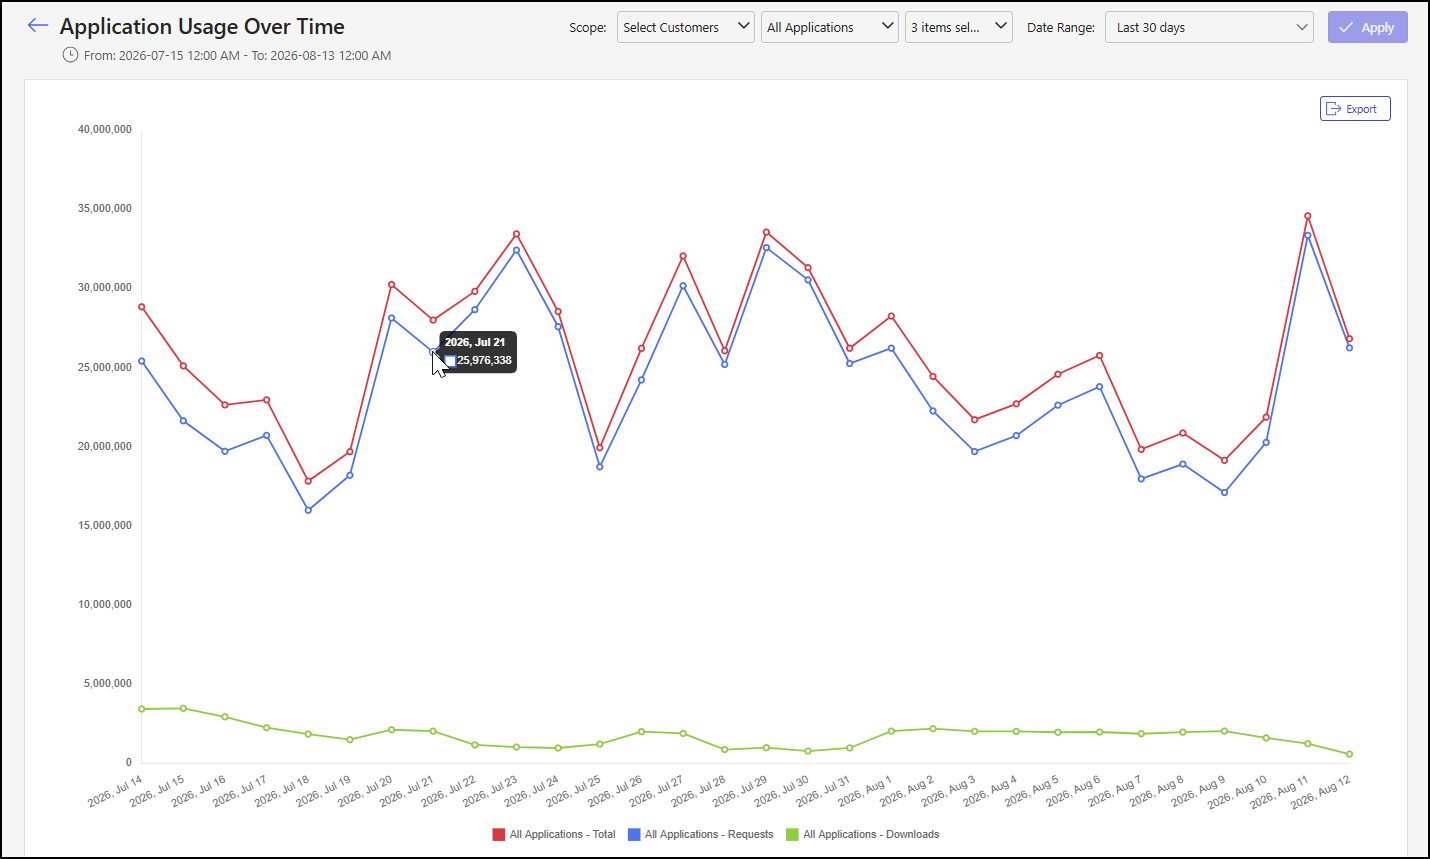
See more details about a data reporting period
To see more details about a specific data reporting period, hover over a point on a line in the Usage Over Time report. For instance, in the example below, a pop-up dialog shows the number of Requests for the 2026, Jul 21 data reporting period.
Download application usage details
To download application usage details in CSV format, select the Export button in the Usage Over Time report.