Users page details
The Users page provides the following report related to your iManage Work users:
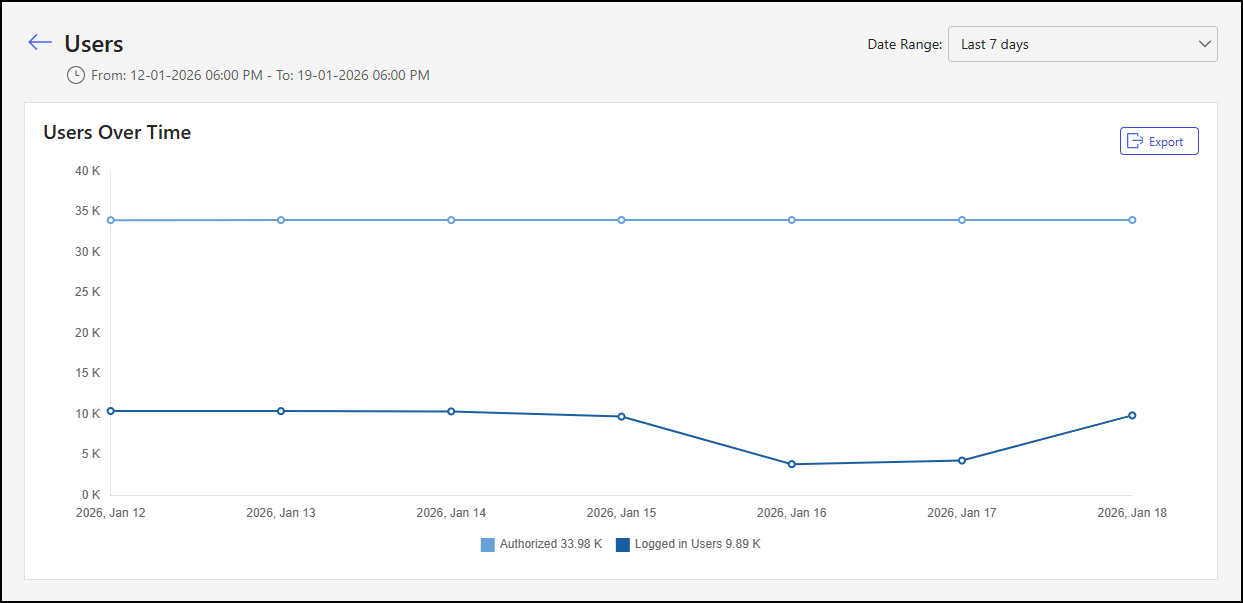
An example of the Users page is shown in the figure below.
NOTES:
This page shows the date range during which the data was collected.
By default, the chart on the Users page displays data about your users from the last seven days.
Report data is available starting from August 3, 2025.
Each reporting interval reflects the number of each object based on a point-in-time snapshot taken within that interval. On the Users page, these snapshots occur daily.
The values shown in the chart legend represent the number for each category in the most recent reporting interval.
To change the reporting period, refer to Users page actions.
Users page actions
On the Users page, you can adjust the data reporting period. For more information on this action, refer to the section below.
Adjust the data reporting period
By default, the Users page report displays data about your iManage Work users from the last week. To change the data reporting period, select from the following options in the Date Range drop-down list:
Yesterday
Last 7 days (default)
Last 30 days
Users Over Time report details
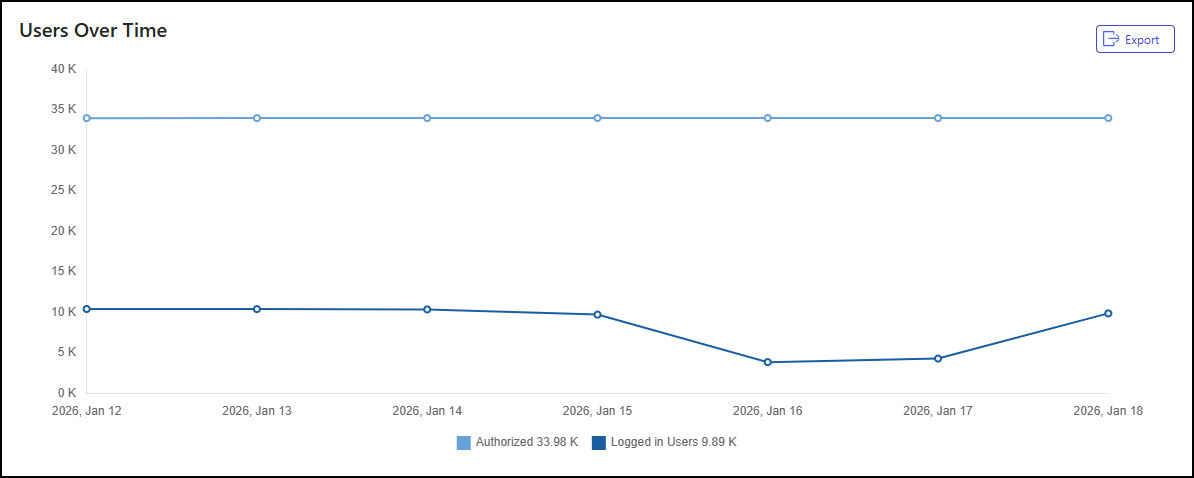
The Users Over Time tile provides the following details about your iManage Work users over the specified data reporting period:
Line charts with a line for each of the following user categories:
The number of authorized users
The number of logged-in users
A legend showing the number for each category in the last reporting interval
An example of the Users Over Time tile is shown in the figure below.
Users Over Time tile actions
In the Users Over Time tile, you can:
Filter the user categories shown in the chart
Hover over a point on a line to see more details about the corresponding user data reporting period
Download user details in CSV format
For more information on these actions, refer to the sections below.
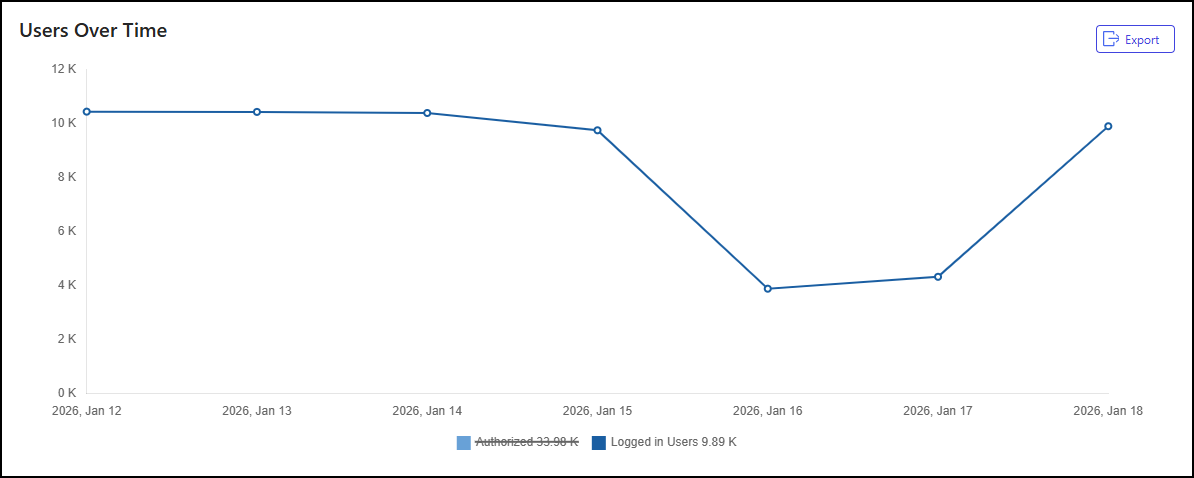
Filter user categories
To filter the user categories shown in the chart, select one or more categories from the legend in the Users Over Time tile. For instance, in the example below, the Authorized category has been removed from the chart.
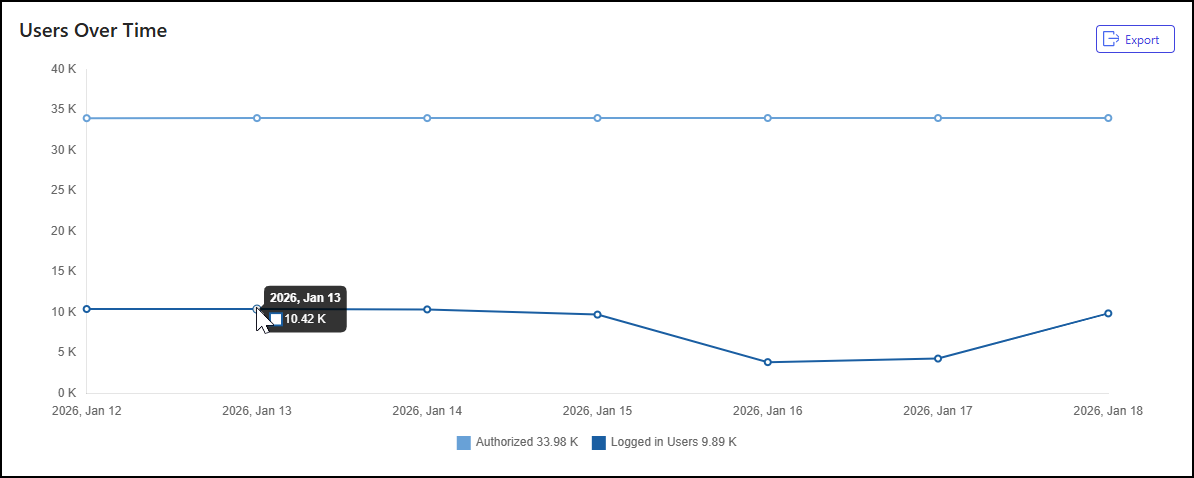
See more details about a data reporting period
To see more details about a specific data reporting period, hover over a point on a line in the Users Over Time tile. For instance, in the example below, a pop-up dialog shows the number of Logged in Users for the 2026, Jan 24 data reporting period.
Download user details
To download counts for your iManage Work users in CSV format, select the Export button in the Users Over Time tile.