Users dashboard details
The Users tile provides the following details about your iManage Work users:
The date range during which the data was collected
The number of authorized/enabled users
The number of logged-in users
A bar chart that breaks down the content into segments for the following categories:
The number of authorized users
The number of logged-in users
An example of the Users tile is shown in the figure below.
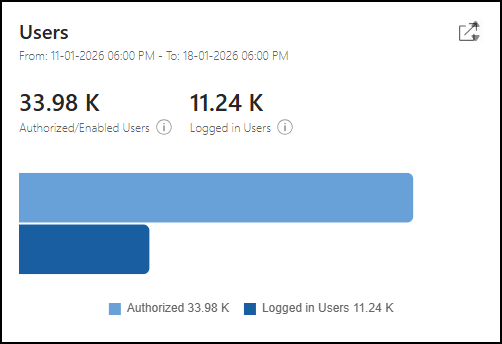
NOTE: In the Users tile:
An authorized user is identified as one who's enabled in iManage Control Center to sign in to iManage Work
The values reflect the number of authorized and logged-in users, based on a point-in-time snapshot taken within the last week.
Users tile actions
In the Users tile, you can:
Filter the user categories shown in the bar chart
Hover over a segment in the bar chart to see more details about a user category
Open another page to view a more detailed report about your users
For more information on these actions, refer to the sections below.
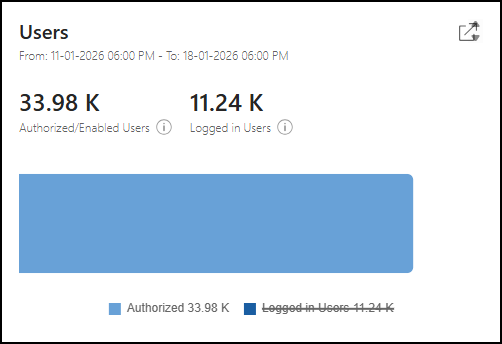
Filter user categories
To filter the user categories shown in the bar chart, select a category from the legend in the Users tile. In the example below, the Logged in Users category has been removed from the bar chart.
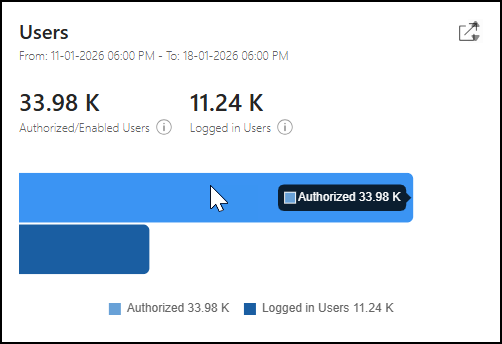
See more details about a category
To see more details about a user category, hover over the corresponding segment in the bar chart of the Users tile. In the example below, a pop-up dialog shows the number of users for the Authorized category.
View a more detailed report
To open a page that displays more details about your users, select the ![]() icon in the Users tile. For more information, refer to Users Over Time report details.
icon in the Users tile. For more information, refer to Users Over Time report details.