The Analytics dashboard provides a snapshot of all collected data points in a single view. The tiles within the dashboard let you see the following information about your system:
Your iManage Work storage usage
The number of documents and emails
The number of authorized and logged-in users
The amount of storage used, broken down by document type
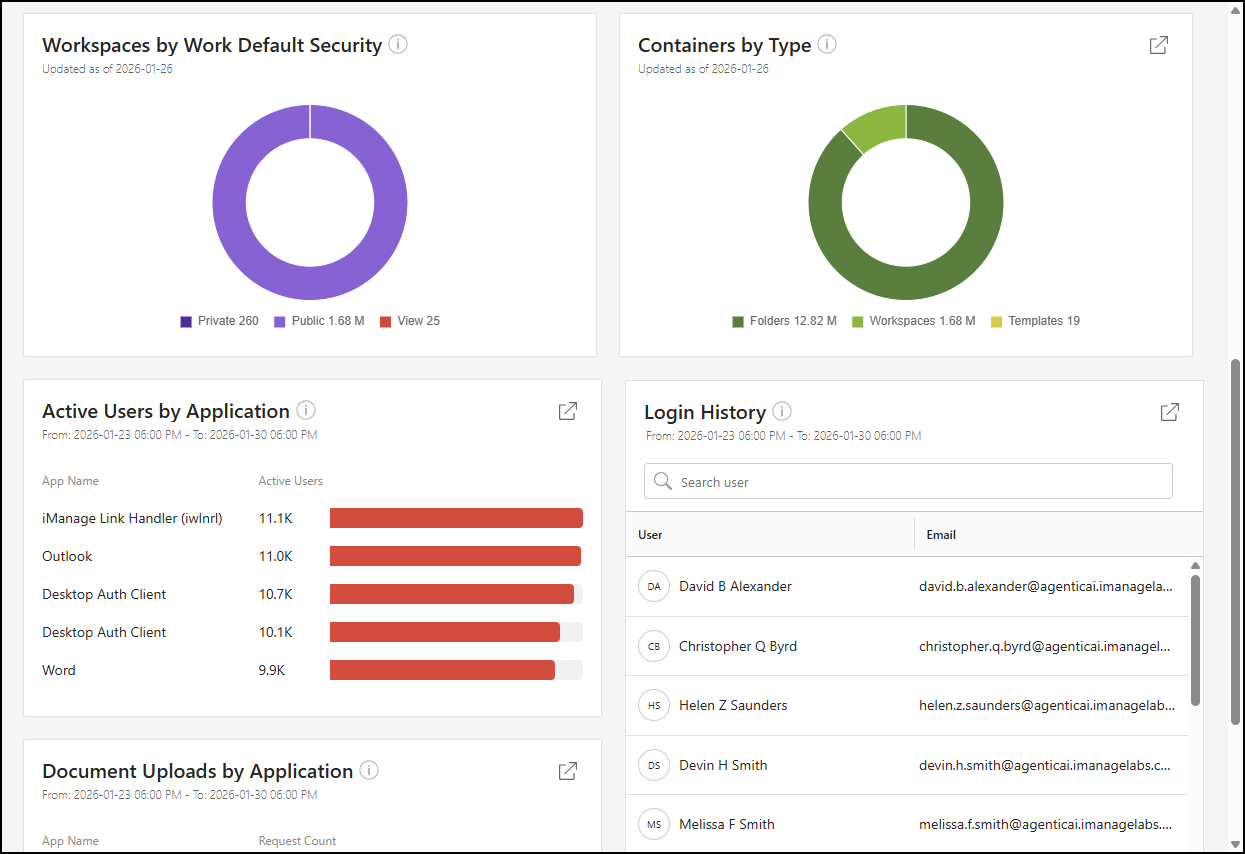
The number of workspaces, categorized by iManage Work default security type
The number of containers, categorized by container type
The number of active users, by application
The number of document uploads, by application
A list of logged-in users
In the dashboard, data is shown for all of your iManage Work libraries, with information collected over the past week.
To view the Cloud Usage Analytics dashboard in iManage Admin Portal:
Go to https://cloudimanage.com/admin/ and sign in with your iManage credentials.
NOTE: To view the Cloud Usage Analytics dashboard, the user account used to sign in to iManage Admin Portal must be assigned either the Cloud Usage Analytics Admin or Viewer role. For more information about granting user access, refer to Access Policy.
Browse to Cloud Analytics > Analytics.
An example of the Analytics page is shown in the figures below.
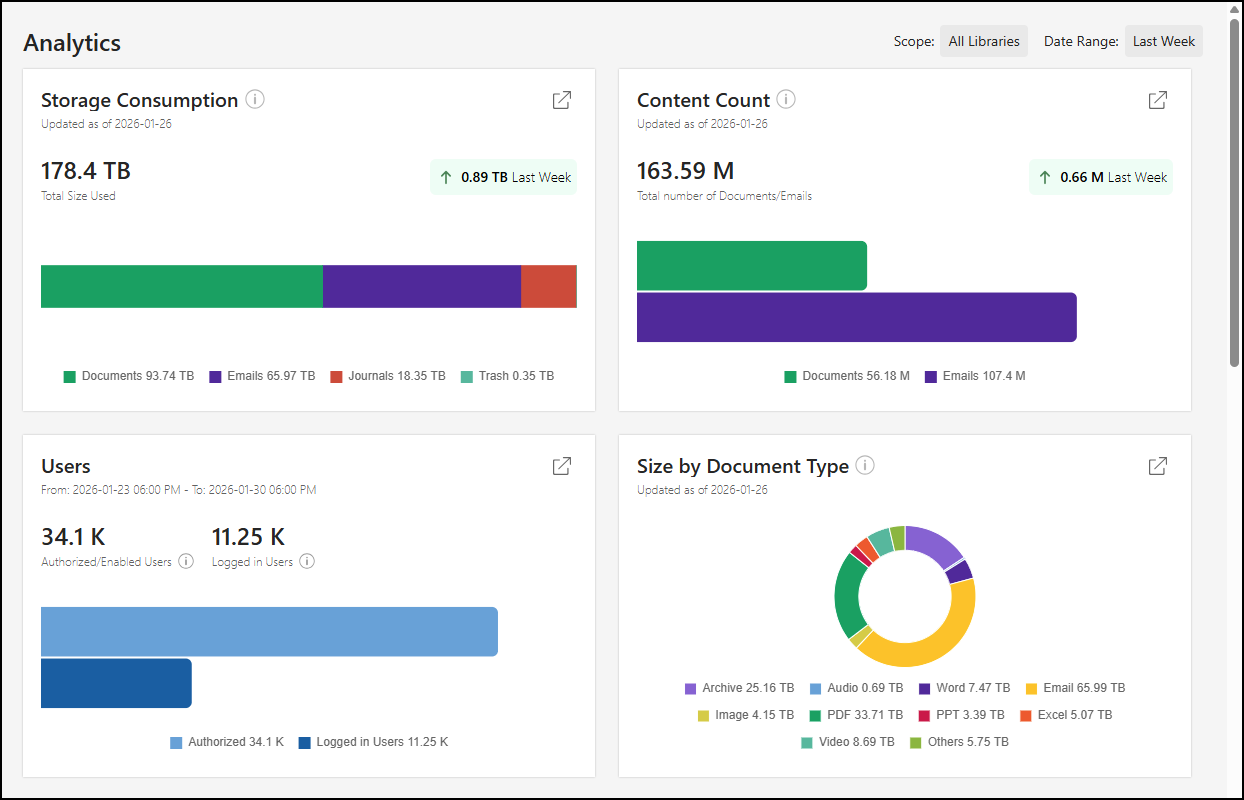
More information about each data point on the Analytics page is provided in the following sections.
- Storage Consumption dashboard tile
- Content Count dashboard tile
- Users dashboard tile
- Size by Document Type dashboard tile
- Workspaces by Work Default Security dashboard tile
- Containers by Type dashboard tile
- Active Users by Application dashboard tile
- Document Uploads by Application dashboard tile
- Login History dashboard tile